Norada Real Estate Investments

  • Home
  • Markets
  • Properties
  • Membership
  • Podcast
  • Learn
  • About
  • Contact

Archives for August 2024

Mortgage Rate Prediction: Kelman Says Will Drink Urine if Rates Don’t Drop

August 13, 2024 by Marco Santarelli

Wild Prediction: Kelman Says Will Drink Urine If Mortgage Rates Don't Drop

Imagine sitting in a serious business meeting when suddenly the CEO drops a bombshell about drinking urine. Sounds like the plot of a quirky movie, right? Instead, it was just another day in the world of real estate during a recent earnings call with Redfin CEO Glenn Kelman.

His offbeat promise that “Plan B is to drink our own urine” if mortgage rates don’t fall has certainly made waves, and it highlights just how wild and unpredictable the current housing market can be.

Redfin CEO Promises to ‘Drink Our Own Urine’ If Mortgage Rates Don’t Fall

The Context Behind the Remark

Kelman’s colorful comment emerged on August 6, 2024, during Redfin's second quarter earnings call, which is typically a platform for CEOs to share optimistic projections and reassure investors (TechCrunch).

However, this year was different. Addressing the challenges of today’s market conditions, which he likened to being in “The Twilight Zone,” Kelman voiced his disbelief: “I can’t remember a time when [mortgage] rates came down this far, this fast, and the market has been so muted in its response.”

For many homeowners and potential buyers caught off guard by rising mortgage rates, Kelman’s words served as a wake-up call, revealing the turmoil lying beneath the surface. With financial constraints tightening, the situation is ripe for bold claims, and Redfin is not shying away from the challenge.

What Led to the Urine Comment?

When pressed about what Redfin’s strategy would be if mortgage rates continued to stay high, Kelman responded with surprising candor. Rather than sugarcoat the issue, he acknowledged the real struggles the company might face, emphasizing that they are strategically prepared. He metaphorically conveyed the seriousness of their predicament with his unusual remark about “drinking our own urine or our competitors’ blood.”

Clearly, Kelman is not in the business of underestimating the competition or the difficulties presented by market downturns. He assured listeners, “We’re ready to take share if the market grows, we’re ready to take share if it doesn’t, but we’re not going to ease off.” This assertive stance is indicative of a company seeking to navigate through rough waters.

The Challenges Facing the Housing Market

The current real estate environment is characterized by several key challenges:

  • High Mortgage Rates: Persistently elevated rates mean less buying power for potential homeowners.
  • Limited Inventory: A shortage of homes for sale continues to strain the market, leading to increased buyer competition.
  • Economic Uncertainty: Factors such as inflation and fluctuations in the job market create apprehension among buyers.

As Kelman pointed out, these conditions have led to a noticeably muted response from the housing market, raising questions about future trends and consumer confidence.

Redfin’s Response to Market Challenges

Even amid a challenging environment, Redfin is taking proactive steps to position itself for success. Here are a few strategies the company is implementing:

  • Aggressive Marketing: Redfin is committed to ramping up its marketing efforts, aiming to capture market share regardless of prevailing conditions.
  • Innovative Technology: Focused on enhancing user experience, the firm is deploying technology to improve its real estate services.
  • Data-Driven Decisions: By effectively utilizing market analytics, Redfin hopes to make informed choices that maximize operational efficiency.

Kelman’s Reflection on His Choice of Words

Towards the end of the earnings call, Kelman acknowledged a bit of regret about his choice of words. “I actually wish I just hadn’t said that,” he reflected, adding, “I’m a lover, not a fighter.” This moment of levity signals that even in high-stakes environments, the humanity of leaders shines through.

What This Means for Investors and Consumers

For investors, Kelman’s remarks suggest that Redfin is bold and ready to adapt regardless of market conditions. For consumers, particularly those considering purchasing a home, these comments indicate that while the real estate sector might be struggling, opportunities still exist as companies innovate and compete for buyers.

Looking Ahead

In a climate as unpredictable as today’s housing market, statements like Kelman’s provoke thought and discussion while highlighting the realities businesses face. As companies like Redfin navigate through these challenging waters, they must remain ready to pivot and adapt to emerging trends.

While we may not have any control over mortgage rates or the unpredictability of the market, we can certainly appreciate the insights from those at the helm as they steer their ships through the tumultuous sea of real estate.


ALSO READ:

  • How to Lower Your Mortgage Payment Without Refinancing?
  • How Lower Mortgage Rates Can Save You Thousands?
  • How to Get a Low Mortgage Interest Rate?
  • Will Mortgage Rates Ever Be 4% Again?
  • Will Mortgage Rates Ever Be 3% Again: Future Outlook
  • Mortgage Rates Predictions for Next 2 Years
  • Mortgage Rate Predictions for Next 5 Years
  • Mortgage Rate Predictions for 2025: Expert Forecast
  • Mortgage Rate Predictions: Why 2% and 3% Rates are Out of Reach

Filed Under: Financing, Mortgage Tagged With: mortgage, Refinance

Top 50 Most Dangerous Cities in the World by Homicide Rates (2024)

August 12, 2024 by Marco Santarelli

Top 50 Most Dangerous Cities in the World by Homicide Rates (2024)

In a world characterized by rapid urbanization and increasing populations, some cities have gained notoriety for their exceptionally high levels of violence and crime. The top 50 most dangerous cities in the world encompass a sobering reality for residents who navigate life amid significant threats. This article compiles comprehensive data sourced from 2022 statistics by “The Citizen Council for Public Security and Criminal Justice.”

Understanding the Metrics of Danger

  • Definition: The world’s most dangerous cities rank by their homicide rates, often reflecting deeper socio-economic challenges.
  • Key Findings:
    • Colima, Mexico is the most dangerous city; it boasts the highest homicide rate of 181.94 per 100,000 people.
    • Tijuana, Mexico, has 105.12 homicides per 100,000 residents, making it one of the most dangerous cities.
    • Socio-economic factors significantly contribute to the crime rates in these regions.

The homicide rate serves as a critical metric for gauging the safety level in various cities, reflecting the number of homicides per 100,000 inhabitants in a given population.

This evaluation excludes cities in active war zones and focuses instead on urban areas where everyday life can be overshadowed by fear and violence. High homicide rates often signal deeper social issues, leading to increased awareness and potential action from community leaders and policymakers.

To formulate a clearer understanding:

  • Homicide Rate: The number of homicides divided by the population, multiplied by 100,000.
  • Population Consideration: Only cities with populations over 300,000 are included, ensuring that the data reflects significant urban settings where crime rates can impact many residents.
  • Country Representation: The list sheds light on regions most impacted by violence, particularly focusing on Latin America, but also highlighting incidents in the U.S. and South Africa.

Top 50 Most Dangerous Cities in the World🚨

Here’s a rigorously compiled list of the top 50 most dangerous cities in the world, drawn from the most recent data available:

Rank City Country Homicides Population Homicides per 100K
1 Colima Mexico 601 330,329 181.94
2 Zamora Mexico 552 310,575 177.73
3 Ciudad Obregón Mexico 454 328,430 138.23
4 Zacatecas Mexico 490 363,996 134.62
5 Tijuana Mexico 2,177 2,070,875 105.12
6 Celaya Mexico 740 742,662 99.64
7 Uruapan Mexico 282 360,338 78.26
8 New Orleans United States 266 376,971 70.56
9 Ciudad Juárez Mexico 1,034 1,527,482 67.69
10 Acapulco Mexico 513 782,661 65.55
11 Mossoró Brazil 167 264,181 63.21
12 Cape Town South Africa 2,998 4,758,405 63.00
13 Irapuato Mexico 539 874,997 61.60
14 Cuernavaca Mexico 410 681,086 60.20
15 Durban South Africa 2,405 4,050,968 59.37
16 Kingston Jamaica 722 1,235,013 58.46
17 Baltimore United States 333 576,498 57.76
18 Nelson Mandela Bay South Africa 687 1,250,484 56.99
19 Salvador Brazil 2,085 3,678,414 56.68
20 Port-au-Prince Haiti 1,596 2,915,000 54.75
21 Manaus Brazil 1,041 2,054,731 50.66
22 Feira de Santana Brazil 327 652,592 50.11
23 Detroit United States 309 632,454 48.86
24 Guayaquil Ecuador 1,537 3,141,793 47.77
25 Memphis United States 302 632,464 47.75
26 Vitória da Conquista Brazil 184 387,524 47.48
27 Cleveland United States 168 367,991 45.65
28 Natal Brazil 569 1,262,741 45.06
29 Cancún Mexico 406 920,865 44.09
30 Chihuahua Mexico 414 944,413 43.84
31 Fortaleza Brazil 1,678 3,936,509 42.63
32 Cali Colombia 1,007 2,392,381 42.09
33 Morelia Mexico 359 853,831 42.05
34 Johannesburg South Africa 2,547 6,148,353 41.43
35 Recife Brazil 1,494 3,745,082 39.89
36 Maceió Brazil 379 960,667 39.45
37 Santa Marta Colombia 280 712,896 39.28
38 León Mexico 782 2,077,830 37.64
39 Milwaukee United States 214 569,330 37.59
40 Teresina Brazil 324 868,523 37.30
41 San Juan Puerto Rico 125 337,300 37.06
42 San Pedro Sula Honduras 278 771,627 36.03
43 Buenaventura Colombia 157 315,743 35.16
44 Ensenada Mexico 157 449,425 34.93
45 Distrito Central Honduras 389 1,185,662 32.81
46 Philadelphia United States 516 1,576,251 32.74
47 Cartagena Colombia 403 1,287,829 31.29
48 Palmira Colombia 110 358,806 30.66
49 Cúcuta Colombia 296 1,004,451 29.47
50 San Luis Potosí Mexico 365 1,265,177 29.06

Key Insights from the Data

  • Prevalence of Violence in Mexico: The Mexican cities dominate the list, with 17 out of 50 cities making the cut. High homicide rates in cities like Tijuana and Acapulco are particularly indicative of the ongoing battle against drug cartels and gang violence.
  • Impact of Socio-Economic Factors: Many cities experience violence due to deep-seated socio-economic issues. Poverty, unemployment, and the lack of educational opportunities contribute to crime’s rise, showcasing a dire need for community development and social programs.
  • U.S. Cities Facing Violence: American cities such as Baltimore and New Orleans reflect systemic issues that contribute to their crime rates. Factors including gang rivalries, economic decline, and gun violence significantly impact these urban environments.
  • Urban Instability in South Africa: Cities like Cape Town and Durban have high homicide rates stemming from gang violence, systemic inequality, and political unrest. These socio-economic factors often cause significant public safety concerns.

Examining Regional Trends

Latin America: A Hotbed of Violent Crime

Latin America has been identified as a region with extreme levels of violence, largely attributed to organized crime. The prevalence of drug cartels and their associated violence poses profound challenges for law enforcement and local governance. Key trends include:

  • Drug Trafficking: The illegal drug trade fuels violence as cartels fight for control over lucrative routes and territories.
  • Youth Involvement in Crime: Many young individuals from economically disadvantaged backgrounds find themselves drawn into gang activities, perpetuating the cycle of violence.
  • Corruption and Weak Institutions: Ineffective policing and widespread corruption further exacerbate safety issues, undermining public trust in law enforcement.

United States: A Different Landscape of Violence

While the U.S. is often considered safer than many Latin American countries, several cities illustrate that violence is a complex and multifaceted issue. Trends include:

  • Gun Violence: High rates of gun ownership contribute to heightened levels of violence and homicide, particularly in urban environments struggling with crime.
  • Economic Disparities: Cities with significant economic struggles often experience elevated crime rates, highlighting the need for economic revitalization and job creation.
  • Community Initiatives: Grassroots movements aimed at improving community relations with law enforcement are critical for reducing crime and improving safety.

South Africa: Ongoing Struggles with Violence

In South Africa, the legacy of apartheid continues to manifest in significant socio-economic disparities and high crime rates. Notable aspects include:

  • Gang Violence: Many urban areas suffer from violent gang warfare, which directly impacts public safety and community relations.
  • Political Instability: Corruption and ineffective governance can lead to increased levels of crime, as law enforcement struggles to maintain order.

Strategies for Change and Prevention

Addressing the challenges reflected in these statistics requires multifaceted approaches, including comprehensive strategies tailored to each community's unique context:

  • Community Engagement: Building trust between residents and law enforcement through community policing initiatives can foster safer neighborhoods. Collaborating with local organizations to host community events and forums is a pathway for open dialogue and shared solutions.
  • Economic Development: Promoting job creation and local business support can alleviate some of the socio-economic pressures leading to crime. Enhancing vocational training and educational programs can open doors for those caught in cycles of poverty.
  • Social Programs: Implementing tailored engagement programs for at-risk youth can divert them from criminal activity. Activities such as sports, arts, mentorship, and educational support can provide constructive alternatives and empower young individuals.
  • International Cooperation: Enhanced collaboration between countries facing similar challenges regarding drug trafficking can help tackle crime at its roots. Joint operations and intelligence sharing may disrupt the operations of transnational criminal organizations.

Final Thoughts:

The narrative behind the top 50 most dangerous cities in the world underscores a pressing need for intervention and reform. Each city depicted reflects unique struggles, revealing the urgent necessity for focused social programs, economic investment, and community engagement initiatives. While the statistics present a grim picture, the potential for positive change exists through collective efforts and commitment to fostering safer communities for all.

Data Source: The list, based on 2022 data from “The Citizen Council for Public Security and Criminal Justice,” identifies locations most afflicted by violence.

Frequently Asked Questions (FAQs)

  1. What defines the most dangerous cities in the world?
    The most dangerous cities are defined primarily by their homicide rates, which represent the number of homicides per 100,000 residents, reflecting socio-economic factors like poverty and gang presence.
  2. Why do Mexican cities dominate the list of most dangerous cities?
    Mexican cities feature prominently due to violence linked to drug trafficking and organized crime, as cartels battle for control over lucrative routes, resulting in elevated violence.
  3. What are some of the key solutions to address urban violence?
    Solutions to reduce urban violence include community engagement with law enforcement, economic development programs for job creation, social initiatives for at-risk youth, and collaboration to combat transnational crime.
  4. Are all high-crime cities in developing countries?
    No, several high-crime cities, such as New Orleans and Baltimore, are in developed nations, showing that violence can occur in any urban environment regardless of a country's economic status.
  5. How can local citizens contribute to reducing crime in their communities?
    Citizens can participate in community policing initiatives, engage with organizations promoting safety, volunteer in youth mentoring programs, and advocate for resources addressing poverty and education.
  6. Which is the most dangerous city in the world?
    According to the list, Colima, Mexico, ranks as the most dangerous city with a homicide rate of 181.94 per 100,000 residents.

Also Read:

  • Top 20 Most Dangerous Cities in Texas 2024: Crime Hotspots
  • Top 50 Most Dangerous Cities in Florida in 2024
  • Top 20 Most Dangerous Cities in Florida: High Crime Rates
  • Is Compton California Dangerous Place to Live: Crime Data
  • Top 10 Most Ghetto Cities in California: Dangerous Cites to Live
  • Top 10 Most Dangerous Cities in the United States 2024
  • 20 Worst Places to Live in the US 2024: Avoid These Cities
  • 20 Worst Places to Live in the US 2024: Avoid These Cities

Filed Under: Best Places, Housing Market Tagged With: Most Dangerous Cities in the World, Top 50 Most Dangerous Cities in the World

Single-Family Rent Forecast 2024 for Renters and Investors

August 12, 2024 by Marco Santarelli

Single-Family Rent Forecast 2024 for Renters and Investors

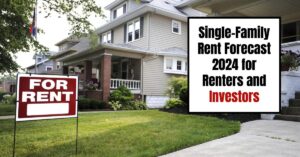
Single-family rents continue their upward climb in 2024, leaving renters across the US wondering just how high the ceiling is. It's a question on everyone's minds: Will this trend continue, or are we due for a cooldown? Let's dive into the current state of single-family rentals, examine the factors driving this market, and explore potential scenarios for the remainder of 2024.

Single-Family Rents in 2024

Current State of the Market: Steady Growth, Regional Variations

As of July 2024, the typical asking rent for a single-family home in the US reached $2,294, representing a 0.4% increase compared to the previous month — Zillow. This figure marks a 4.7% surge from July 2023 and a significant 40.1% leap since the onset of the pandemic.

While the overall trend points towards growth, regional variations are apparent. Some major metropolitan areas witnessed a slight dip in single-family rents month-over-month:

  • Milwaukee: -0.7%
  • Austin: -0.02%

However, the broader picture reveals that 49 out of the 50 largest metro areas experienced year-ago increases. The most substantial annual jumps were concentrated in the Midwest:

  • Cleveland: 8.6%
  • Cincinnati: 7.8%
  • Indianapolis: 7.5%
  • Columbus: 7.2%
  • Louisville: 7.2%

Factors Driving Single-Family Rent Increases

Understanding the forces behind these rent hikes is crucial for both renters and investors. Several key factors are contributing to the upward pressure on single-family rents:

  • Housing Shortage: The US continues to grapple with a housing shortage, particularly in the single-family market. Low inventory levels, driven by years of underbuilding and increased demand, give landlords more leverage to raise rents.
  • Rising Interest Rates: The Federal Reserve's efforts to combat inflation have led to significantly higher mortgage rates. This has pushed homeownership out of reach for many potential buyers, increasing the demand for rentals and putting upward pressure on single-family rents.
  • Inflation and Economic Uncertainty: Persistent inflation is impacting costs across the board, including property taxes, maintenance, and insurance for landlords. These increased operating expenses are often passed on to renters in the form of higher rents.
  • Demographic Shifts: The largest generation in US history, Millennials, are increasingly seeking out the space and amenities offered by single-family homes as they enter their prime family-raising years. This surge in demand further contributes to rising single-family rents.
  • Remote Work Flexibility: The rise of remote work, accelerated by the pandemic, has allowed for greater geographic flexibility. Many renters are now choosing single-family homes in suburban or even rural areas, driving up demand and rents in those markets.

Forecast for the Remainder of 2024: Cautious Optimism or Continued Climb?

Predicting the future of any market is a complex endeavor, but by analyzing current trends and potential influencing factors, we can outline possible scenarios for single-family rents in the latter half of 2024:

Scenario 1: Moderate Growth Continues

This scenario assumes that current trends largely persist. Factors supporting this outlook include:

  • Continued Housing Shortage: The housing shortage is a long-term issue unlikely to be resolved quickly.
  • Elevated Interest Rates: While a sharp increase in interest rates is not anticipated, they are expected to remain relatively high, continuing to impact affordability for homebuyers.
  • Steady Demand for Single-Family Homes: Demand for the space and amenities offered by single-family rentals, especially from Millennials starting families, is projected to remain strong.

Scenario 2: Growth Slows, Potential for Stabilization

Factors that could contribute to this scenario include:

  • Easing Inflation: Should inflation continue to cool, the pressure on landlords to increase rents to cover expenses may lessen.
  • Increased Housing Supply: Even modest increases in new construction, particularly in the single-family market, could help alleviate some pressure on single-family rents.
  • Shifting Renter Preferences: If economic uncertainty lingers, some renters might opt for more affordable options like smaller units or shared housing, potentially impacting demand for single-family rentals.

Scenario 3: Unforeseen Economic Factors

The real estate market is sensitive to broader economic conditions. Unforeseen events, such as:

  • Recession: A significant economic downturn could lead to job losses and decreased demand for rentals, potentially causing single-family rents to stagnate or even decline.
  • Changes in Government Policy: New legislation or regulations related to housing, interest rates, or taxation could have unpredictable effects on the rental market.

Navigating the Single-Family Rental Market in 2024

Whether you're a renter searching for your next home or an investor evaluating opportunities, understanding the dynamics of the single-family rental market is paramount.

Tips for Renters:

  • Start your search early: Due to low inventory, it's crucial to begin your search well in advance of your desired move-in date.
  • Be prepared to be flexible: Consider expanding your search geographically to include areas with potentially lower rents.
  • Negotiate with landlords: Don't be afraid to negotiate lease terms, such as rent amount or length of lease, especially in a competitive market.

Tips for Investors:

  • Conduct thorough market research: Identify areas experiencing high demand for single-family rentals and carefully analyze potential return on investment.
  • Factor in rising costs: Account for potential increases in property taxes, insurance, and maintenance when calculating expenses and setting rental rates.
  • Stay informed about market trends: Continuously monitor economic indicators, housing market data, and rental trends to make informed investment decisions.

Soaring rental rates are transforming the single-family rental market in 2024. Yet, underlying economic forces offer potential for both renters and investors who can navigate these changing conditions.


ALSO READ:

  • Good News for Renters? Single-Family Rent Growth Slows Down
  • Housing Market Trends: How BIG Investors Are Shaping Single-Family Rentals
  • Single Family Rental Homes vs Multi-Family Investing in 2024
  • Housing Market 2024: Key Predictions for the Remainder of the Year
  • Midwest Housing Market: The Unexpected Trends You Won't Believe
  • Real Estate Forecast Next 5 Years: Top 5 Predictions for Future
  • Housing Market Predictions for the Next 2 Years
  • Housing Market Predictions for Next 5 Years (2024-2028)
  • Will the Housing Market Crash in 2025?
Filed Under: Housing Market, Real Estate Market Tagged With: Housing Market, Single-Family Homes, Single-Family Rent

Housing Market Trends: How BIG Investors Are Shaping Single-Family Rentals

August 12, 2024 by Marco Santarelli

Housing Market Trends: How BIG Investors Are Shaping Single-Family Rentals

Big investors are buying up single-family homes, impacting rent prices & homeownership. Is this trend is shaping the housing market? A new watchdog report from the U.S. Government Accountability Office (GAO) sheds light on the growing presence of institutional investors in the single-family rental market and the factors influencing their emergence. This article explores how the 2007-2009 financial crisis paved the way for these large-scale investors to enter the market and the factors that fueled their growth.

Capitalizing on Opportunity:

The financial crisis created a unique opportunity for institutional investors. With a surge in foreclosed homes flooding the market, local auctions offered a chance to acquire properties in bulk. This was particularly attractive due to:

  • Economies of Scale: Buying large numbers of homes simultaneously allowed for more efficient management and potentially lower costs per unit.
  • Pricing Power: The sheer volume of purchases gave institutional investors significant leverage in determining rental prices within specific markets.

Beyond Auctions:

Institutional investors didn't limit themselves to auctions. They also participated in initiatives like Fannie Mae's REO-to-Rental program, which offered foreclosed properties in areas heavily impacted by the crisis.

Financial Muscle:

Institutional investors had a distinct advantage when it came to financing their purchases. They possessed access to a wider range of funding sources compared to smaller investors and individual buyers. These included:

  • Private Equity Funds
  • Public Equity and Debt Securities
  • Securitization of Rental Income
  • Government-Backed Loans

A Lending Landscape in Flux:

While institutional investors enjoyed diverse funding options, the situation for traditional homebuyers was quite different. Mortgage lenders had tightened their lending standards, making it harder for many to qualify for homeownership in the aftermath of the crisis. This further tilted the playing field in favor of institutional investors who could offer cash upfront.

The Technological Edge:

Technological advancements played a crucial role in enabling institutional investors to manage large portfolios efficiently. Digital platforms streamlined property acquisition, allowing for targeted purchases based on specific investment criteria. Online portals also facilitated tenant management, enabling them to search for rentals, submit applications, and pay rent electronically.

The Impact of Institutional Investors on the Housing Market

The emergence of institutional investors in the single-family rental market has sparked debate about its potential consequences. This part will explore the findings from the GAO report on the impact of these investors on various aspects of the housing market.

Potential Benefits:

The GAO report acknowledges that institutional investors may have contributed to some positive developments in the housing market, including:

  • Stabilization of Neighborhoods: Following the financial crisis, many neighborhoods faced vacancy and blight due to foreclosures. Institutional investors' purchases may have helped stabilize these areas by filling vacant homes and improving property maintenance.

Potential Drawbacks:

While some potential benefits exist, the GAO report also highlights concerns regarding the impact of institutional investors:

  • Impact on Homeownership Rates: A significant portion of the single-family rental market is now owned by institutional investors. This raises concerns about the reduced availability of homes for purchase, potentially hindering homeownership opportunities, particularly for first-time buyers.

Uncertainties and the Need for More Data:

The GAO report acknowledges that the full impact of institutional investors on the housing market remains unclear due to limitations in data and the lack of a consistent definition for “institutional investor.” Here are some key uncertainties highlighted in the report:

  • Impact on Rents: The extent to which institutional investors contribute to rising rents is unclear. More data is needed to understand their pricing strategies and how they affect rental markets across different regions.
  • Impact on Eviction Rates: There is a lack of data on how institutional investors' ownership affects eviction rates for tenants. Understanding this aspect is crucial for assessing the stability and affordability of rental housing.

Policy Considerations and Further Research

The growing presence of institutional investors in the single-family rental market raises important policy questions. This part will explore potential policy considerations and areas for further research identified in the GAO report.

Policy Considerations:

  • Data Collection and Standardization: Establishing a consistent definition for “institutional investor” and improving data collection efforts are crucial to gain a clearer understanding of their impact on the housing market. This data could inform the development of targeted policies.
  • Promoting Homeownership: If reduced homeownership opportunities are a concern, policymakers might explore initiatives to support first-time homebuyers, such as down payment assistance programs or tax incentives.
  • Balancing Investor Activity with Affordability: Finding ways to encourage investment in rental housing while ensuring affordability for tenants is a key challenge. Policies could explore areas like rental assistance programs or tax breaks for investors who maintain affordable rents.

Further Research:

The GAO report highlights the need for further research in several areas to fully understand the impact of institutional investors:

  • Investor Strategies: A deeper understanding of institutional investors' acquisition and pricing strategies, as well as their long-term plans for their rental portfolios, would be beneficial.
  • Geographic Impact: Researching how institutional investor activity varies across different geographic locations and housing markets could provide valuable insights.
  • Tenant Outcomes: More data is needed to assess the impact of institutional ownership on tenant experiences, including eviction rates, maintenance responsiveness, and overall satisfaction.

By addressing these policy considerations and conducting further research, policymakers can work towards creating a housing market that benefits both investors and renters, while ensuring opportunities for homeownership remain accessible.

Looking Ahead:

The rise of institutional investors in the single-family rental market is a complex issue with both potential advantages and challenges. As the market continues to evolve, ongoing research and informed policy decisions will be crucial for fostering a healthy and balanced housing ecosystem.

Conclusion

The emergence of institutional investors in the single-family rental market represents a significant shift in the housing landscape. This four-part series, informed by the U.S. Government Accountability Office (GAO) report, has explored the factors behind their rise, their potential impact on the market, and considerations for the future.

Key Takeaways:

  • The 2007-2009 financial crisis created opportunities for institutional investors to enter the single-family rental market through bulk purchases at auctions and programs like Fannie Mae's REO-to-Rental initiative.
  • Their access to capital, combined with technological advancements, allowed them to efficiently manage large portfolios.
  • While institutional investors may have contributed to neighborhood stabilization, concerns exist regarding their impact on homeownership rates, rental prices, and tenant experiences.

The Path Forward:

Addressing the complexities of this issue requires a multi-pronged approach:

  • Data and Standardization: Consistent data collection and a clear definition of “institutional investor” are essential for effective policymaking.
  • Policy Considerations: Exploring measures like promoting homeownership, encouraging affordable rentals, and improving data collection can help ensure a balanced housing market.
  • Further Research: A deeper understanding of investor strategies, geographic variations, and tenant outcomes is crucial to inform future policy decisions.

Looking to the future, fostering healthy competition, ensuring access to homeownership, and guaranteeing affordable rentals for all stakeholders remain key priorities. By prioritizing data-driven decision-making and ongoing research, we can create a housing market that thrives on innovation while meeting the needs of both investors and residents.


ALSO READ:

Housing Market Predictions for Next 5 Years (2024-2028)

Housing Market Predictions for the Next 2 Years

Housing Market Predictions 2024: Will Real Estate Crash?

Housing Market Predictions: 8 of Next 10 Years Poised for Gains

Housing Market Cooling Faster Than Expected?

Is the Housing Market Shifting? Key Trends to Watch (April Report)

Filed Under: Housing Market, Real Estate Investing, Real Estate Market Tagged With: Housing Market, Real Estate Investing, Single-Family Rentals

Florida Housing Market Predictions 2024: Will it Crash?

August 12, 2024 by Marco Santarelli

Florida Housing Market Predictions 2024

In the realm of real estate, the desire for mortgage rates to return to the 3% range and bidding wars for new listings may remain unfulfilled. However, experts project that in 2024, the Florida housing market is poised for strength, offering ample opportunities for real estate professionals.

Adam Grenville, a sales associate with RE/MAX Premier Group, emphasizes the importance of fostering relationships, and professionalism and providing excellent service to all involved in real estate transactions. Real estate coach Tom Ferry also advises agents to focus on taking action in today's market reality.

Florida Housing Market Predictions 2024

Looking ahead to 2024, experts anticipate a strengthening Florida housing market driven by population and business growth. Dr. Brad O’Connor, chief economist at Florida Realtors®, notes a return to a pre-pandemic sales pattern with increasing inventory that has slowed price growth. Buyers and sellers are closely watching mortgage rates.

Diana Galavis, broker-associate at Watson Realty, highlights that it will still be a seller's market, even as inventory levels rise. To navigate this market, knowing the statistics and trends in your area is crucial for managing price point expectations.

Population Growth

Florida continues to experience in-migration, driving the demand for homes and condominiums. The state is an attractive location for remote workers, thanks to its affordability and larger housing options compared to the Northeast and West Coast.

Recent population growth has been concentrated in large metro areas, particularly Orange, Hillsborough, Lee, Polk, and Palm Beach counties. This migration is contributing to job formation and strengthening both residential and commercial sectors.

Florida is also witnessing a steady increase in household formation, especially among young adults. This is an excellent time to engage with Gen Z individuals about their housing needs.

International Market

While Florida remains a top market for international buyers, this sector is recovering more slowly than the domestic market. Factors like the strong dollar and geopolitical uncertainties are causing some international buyers to delay their purchases.

New-Home Market

On the supply side, new home production is struggling to keep up with demand. Partnering with builders is one option to expand inventory options for buyers. Lisa Hill, a broker-associate, suggests that buyers should consider new construction due to low inventory.

Residential developments are expanding to outlying areas due to the growth in hybrid work. Grenville emphasizes the importance of exploring new communities, as new-construction properties are a viable option for buyers.

Multifamily and hospitality sectors are also experiencing strong development activity, offering opportunities for real estate professionals.

Pricing and Rates

Home prices and mortgage rates will be key concerns for buyers and sellers in 2024. Pricing is unlikely to go down due to low active listings and strong demographic demand. Mortgage rates also impact institutional buyers and first-time buyers.

Higher rates have a negative impact on the move-up market, leaving a void in this segment. The luxury segment is less affected by rate changes, with many buyers making all-cash purchases.

Real Estate Professional's Role

In an uncertain mortgage environment, the role of knowledgeable real estate professionals becomes crucial. They can help buyers secure the lowest price and assist sellers in maximizing their sale proceeds. Going back to basics, such as open houses and door-knocking, can be effective strategies for generating business in 2024.

Filed Under: Growth Markets, Housing Market Tagged With: florida housing market, Florida Housing Market Predictions

America’s 20 Hottest Housing Markets: July 2024 Rankings

August 12, 2024 by Marco Santarelli

America's 20 Hottest Housing Markets: July 2024 Rankings

Forget the coasts! This summer, America's hottest real estate markets are whispering tales of affordability and a quieter pace of life. Ditching the typical big-city buzz, buyers are flocking to unexpected locales, snapping up homes with lightning speed.

As per Realtor.com's Market Hotness rankings, leading the charge in July is Oshkosh, WI, a name synonymous with beloved children's clothing but now making headlines for its scorching hot real estate. Boasting a median list price of $374,000—a whopping $65,950 below the national average—Oshkosh offers budget-friendly housing coupled with a peaceful atmosphere.

This shift towards affordability and a less frenetic pace is reflected throughout Realtor.com's July hottest housing markets list, which reveals some intriguing trends:

Price Surge and Soaring Demand: A Snapshot of the Hottest Markets

The hottest housing markets are outperforming the national average in both price growth and demand. While the national housing market witnessed flat year-over-year prices in July, the hottest markets told a different story.

Here's a glimpse into the trends:

  • Price Growth: July witnessed a significant uptick in price growth in the hottest markets. It rose from 8.1% in June to an average of 11.0% in July, fueled by intense competition.
  • Demand: Measured by views per property, demand in the hottest markets was an impressive 2.8 times higher than the national level in July, consistent with the previous month.

Let's take the example of Oshkosh-Neenah, WI, our hottest market for July:

  • Listing Viewership: This metro area saw an astounding 3.7 times more listing viewership compared to the US average in July.
  • Price Appreciation: Prices in the Oshkosh-Neenah metro area climbed significantly, registering a 15.0% year-over-year increase.

Inventory Struggles: A Tale of High Demand and Limited Supply

While active listings nationwide saw a 36.6% year-over-year increase in July, the hottest markets presented a contrasting picture. The average inventory growth in the top 20 hottest markets was a relatively modest 18.4% year-over-year in July.

Here's a closer look at the inventory landscape:

  • National Inventory: Inventory remained approximately 30% below pre-pandemic levels in July.
  • Hottest Markets Inventory: The hottest markets experienced a sharper decline, with an average 66.9% decrease in inventory during the same period.

This disparity in inventory levels between the national average and the hottest markets underscores the impact of surging demand coupled with limited supply. It's a classic case of too many buyers vying for too few homes, creating a highly competitive environment.

The combination of high demand and scarce inventory fuels higher views-per-property, intensifying competition in the hottest markets. As a result, homes in these sought-after locations are being snapped up at a faster pace.

In July, the average time a home spent on the market in the hottest markets was just 26 days – a remarkable 5 days faster than the previous year and roughly half the national median.

New Entrants and Notable Climbers: Tracking Market Movement

The July Hottest Housing Markets list welcomed some new entrants and witnessed some significant upward movement from previous contenders:

Consistent Performers: A significant majority – 14 out of 20 markets – from June's list maintained their presence in July's rankings.

  • Biggest Jumpers:
  • Monroe, MI: Leap frogged from 36th to 6th position.
  • Rochester, NY: Climbed impressively from 38th to 9th position.

Other Notable Climbers:

  • Lancaster, PA
  • Peoria, IL
  • Green Bay, WI
  • Cleveland-Elyria, OH

A year-over-year analysis of the 300 ranked markets reveals some noteworthy climbers:

  • Bellingham, WA: Shot up an impressive 131 spots.
  • Syracuse, NY: Climbed significantly, gaining 107 spots.
  • Champaign-Urbana, IL: Marked a notable rise of 102 spots.

Departing Markets: Shifting Dynamics

Six markets that enjoyed a spot in June's top 20 dropped off the list in July:

  • Bridgeport-Stamford, CT
  • Columbus, OH
  • Reading, PA
  • Erie, PA
  • Lafayette, IN
  • Norwich, CT

However, their departure wasn't a steep fall. They settled within a respectable range of 22nd to 43rd, demonstrating continued desirability. This persistence underscores the enduring appeal of Midwest and Northeast metros, which have dominated the hottest markets list since February 2022.

When we shift our focus to the metros that experienced the most significant decline in ranking over the past year, a pattern emerges:

  • Southern and Western Markets: The metros experiencing the steepest decline are primarily concentrated in the Southern and Western regions of the US.

The metros that have witnessed the most significant decline in ranking are:

  • Lubbock, TX: Dropped 131 spots.
  • Wichita Falls, TX: Fell 116 spots.
  • Decatur, AL: Experienced a decline of 112 spots.
  • Yuma, AZ: Slipped down 104 spots.

The Top 20 Hottest Markets – July 2024

1. Oshkosh, WI

  • Median List Price: $374,000
  • Days on Market: 18

Oshkosh has emerged as the hottest housing market, recognized for its affordability and rapid sales pace. Properties here are attracting immense buyer interest, boasting an average of only 18 days on the market—significantly quicker than the national average. Its picturesque setting by Lake Winnebago and a thriving local community make it a desirable place for families and first-time buyers.

2. Hartford, CT

  • Median List Price: $444,000
  • Days on Market: 22

Hartford continues to showcase a robust housing market with its rich history and proximity to major metropolitan areas. Homebuyers are drawn by a blend of urban conveniences and suburban living. Listings in Hartford are selling quickly, typically within 22 days, highlighting its growing appeal to families seeking a new home in Connecticut.

3. Manchester, NH

  • Median List Price: $585,000
  • Days on Market: 20

As the largest city in New Hampshire, Manchester offers a vibrant culture, excellent schools, and no state income tax. The median list price may be higher at $585,000, but homes spend only 20 days on the market, reflecting robust demand. This city attracts those looking for a balance between urban amenities and outdoor recreation.

4. Rockford, IL

  • Median List Price: $216,000
  • Days on Market: 24

Rockford is proving that affordability does not have to compromise quality of life. With a median list price of just $216,000, it remains one of the most accessible markets in the top rankings. Homes here typically remain on the market for 24 days, making it an excellent option for first-time homebuyers and those looking to relocate.

5. Akron, OH

  • Median List Price: $257,000
  • Days on Market: 25

Akron stands out due to its low median list price of $257,000, attracting buyers seeking homeownership without the hefty financial burden. With an average of 25 days on the market, homes are moving swiftly, showcasing the high demand for this affordable market in Ohio.

6. Monroe, MI

  • Median List Price: $305,000
  • Days on Market: 27

Monroe's location along Lake Erie and its family-friendly atmosphere contribute to its appeal. With homes spending 27 days on the market and a median price of $305,000, it finds a sweet spot for buyers searching for charm and affordability.

7. New Haven, CT

  • Median List Price: $425,000
  • Days on Market: 27

Home to Yale University, New Haven blends cultural vibrancy with historical significance. The competitive market sees homes being sold within 27 days, with a median list price of $425,000, catering to both academia aficionados and families looking for a dynamic urban setting.

8. Rochester, NY

  • Median List Price: $300,000
  • Days on Market: 21

Offering rich cultural experiences and strong community ties, Rochester has a lot to offer homebuyers. Properties are moving quickly, with a 21-day average on the market and a median price of $300,000, making it an attractive option for diverse demographics.

9. Janesville, WI

  • Median List Price: $335,000
  • Days on Market: 30

Janesville's appealing price point of $335,000 draws many to the region. Homes here stay on the market for about 30 days, appealing to buyers who appreciate affordability paired with a tight-knit community atmosphere.

10. Providence, RI

  • Median List Price: $599,000
  • Days on Market: 27

As Rhode Island's capital, Providence lures buyers looking for a mix of city life and coastal charm. With a higher median list price of $599,000, homes are still selling quickly at an average of 27 days on the market, highlighting its desirability.

11. Canton, OH

  • Median List Price: $270,000
  • Days on Market: 23

Canton is gaining traction due to its affordability and community spirit. Homes here average 23 days on the market and have a median price of $270,000, making it an attractive option for homebuyers.

12. Springfield, IL

  • Median List Price: $223,000
  • Days on Market: 24

With a median price of $223,000, Springfield's market is appealingly accessible. Homes are in high demand, selling within 24 days on average, making it an attractive destination for new families and first-time buyers.

13. Springfield, MA

  • Median List Price: $400,000
  • Days on Market: 30

Springfield, MA, carries historical significance and continues to attract new residents. Here, homes remain on the market for approximately 30 days with a median list price of $400,000, appealing to diverse buyers.

14. Syracuse, NY

  • Median List Price: $371,000
  • Days on Market: 30

Syracuse combines affordable living with a vibrant cultural scene, reflected in its median price of $371,000. Homes typically sell within 30 days, ensuring steady buyer interest.

15. Lancaster, PA

  • Median List Price: $432,000
  • Days on Market: 28

Lancaster's charming rural atmosphere attracts homebuyers, despite its higher median price of $432,000. Homes remain on the market for an average of 28 days, indicating strong buyer interest.

16. Peoria, IL

  • Median List Price: $179,000
  • Days on Market: 31

Peoria shines with an incredibly low median list price of $179,000. Homes typically linger on the market for 31 days, making it an excellent entry point for budget-conscious buyers.

17. Concord, NH

  • Median List Price: $637,000
  • Days on Market: 33

As the state capital, Concord commands higher prices reflected in its median list price of $637,000. Homes remain on the market for about 33 days, balancing luxury with a serene New England lifestyle.

18. Green Bay, WI

  • Median List Price: $474,000
  • Days on Market: 29

Known for its passionate sports culture, Green Bay’s real estate market features homes that average 29 days on the market with a median list price of $474,000, making it appealing to a wide range of buyers.

19. Worcester, MA

  • Median List Price: $550,000
  • Days on Market: 31

Worcester's rich educational institutions and cultural activities attract residents. Homes here have a median list price of $550,000 and typically spend 31 days on the market, reflecting growing interest.

20. Cleveland, OH

  • Median List Price: $272,000
  • Days on Market: 32

Cleveland rounds out the list with a low median list price of $272,000. Homes typically stay on the market for 32 days, reflecting its established market and affordable entry points.

Hottest Metros Hotness Rank Hotness Rank YoY Viewers per Property vs US Median Days On Market Days on Market YoY Median Listing Price If Active Within Period
Oshkosh-Neenah, Wis. 1 -9 3.7 18 -13 $374,000
Hartford-West Hartford-East Hartford, Conn. 2 1 4.3 22 -2 $444,000
Manchester-Nashua, N.H. 3 0 3.2 20 -3 $585,000
Rockford, Ill. 4 -3 3.3 24 0 $216,000
Akron, Ohio 5 -22 2.7 25 -10 $257,000
Monroe, Mich 6 -29 2.8 27 -10 $305,000
New Haven-Milford, Conn. 7 -4 3 27 -2 $425,000
Rochester, N.Y. 8 6 2.5 21 6 $300,000
Janesville-Beloit, Wis. 9 -49 3.3 30 -11 $335,000
Providence-Warwick, R.I.-Mass. 10 -16 2.5 27 -9 $599,000
Canton-Massillon, Ohio 11 -28 2.4 23 -12 $270,000
Springfield, Ill. 12 -39 2.3 24 -12 $223,000
Springfield, Mass. 13 8 2.7 30 7 $400,000
Syracuse, N.Y. 14 -107 2.5 30 -21 $371,000
Lancaster, Pa. 15 -14 2.2 28 -7 $432,000
Peoria, Ill. 16 -52 2.5 31 -10 $179,000
Concord, N.H. 17 13 2.8 33 9 $637,000
Green Bay, Wis. 18 -20 2.2 29 -8 $474,000
Worcester, Mass.-Conn. 19 10 2.4 31 6 $550,000
Cleveland-Elyria, Ohio 20 -44 2.4 32 -8 $272,000

Large Markets Heating Up: A Shift in the Landscape

The largest 40 housing markets across the country experienced a collective increase in heat this July, with an average of 3 ranks higher compared to July 2023. However, this year-over-year surge is the smallest since February 2023, signaling a potential stabilization.

  • Increased Demand: These larger urban markets witnessed approximately 6.5% more views per listing compared to the national average in July.
  • Faster Sales: Homes in these markets sold at a swifter pace, spending 9 fewer days on the market than the national median.
  • Price Adjustments: Interestingly, prices in these large markets saw an average annual decline of 1.1% – the first such instance recorded in the data's history. This suggests a potential market adjustment in response to somewhat subdued buyer demand, leading to the sale of lower-priced homes.

The observed slowing price growth, both nationally and in the largest markets, can be partly attributed to a shift in the available inventory:

  • Rise of Affordable Housing: There's been a surge in affordable inventory. Nationally, there are roughly 47% more homes listed within the price range of $200,000 to $350,000 compared to the previous year.

Top Gainers: Large Markets Making Strides

This July, five large metros stood out with the most significant jumps in their rankings:

  • Las Vegas-Henderson-Paradise, NV: An impressive leap of 73 spots.
  • Philadelphia-Camden-Wilmington, PA-NJ-DE-MD: A substantial climb of 69 spots.
  • Kansas City, MO-KS: A noteworthy gain of 63 spots.
  • Minneapolis-St. Paul-Bloomington, MN-WI: Another significant rise of 63 spots.
  • Chicago-Naperville-Elgin, IL-IN-WI: A remarkable jump of 61 spots.

These upward-trending markets secured rankings ranging from 55th (Chicago) to 184th (Las Vegas) on July's list.

Markets Seeing the Largest Jump in Rankings (July 2024): A Closer Look

Metro Hotness Rank Hotness Rank YoY Viewers per Property vs US Median Days On Market Days on Market YoY Median Days On Market Vs Us
Las Vegas-Henderson-Paradise, Nev. 184 -73 0.70 39 -7 -11
Philadelphia-Camden-Wilmington, Pa.-N.J.-Del.-Md. 108 -69 1.30 41 -4 -9
Kansas City, Mo.-Kan. 159 -63 1.20 47 -4 -3
Minneapolis-St. Paul-Bloomington, Minn.-Wis. 72 -63 1.20 32 -4 -18
Chicago-Naperville-Elgin, Ill.-Ind.-Wis. 55 -61 1.30 29 -7 -21

These top 20 hottest markets highlight the diverse opportunities available across the U.S. from budget-friendly options in cities like Rockford and Peoria to more expensive choices like Concord and Providence. As buyer interest surges, understanding the trends in each of these markets becomes crucial for potential homeowners and investors eager to navigate the current landscape effectively.


ALSO READ:

  • Housing Market 2024: Key Predictions for the Remainder of the Year
  • Midwest Housing Market: The Unexpected Trends You Won't Believe
  • Real Estate Forecast Next 5 Years: Top 5 Predictions for Future
  • Housing Market Predictions for the Next 2 Years
  • Housing Market Predictions for Next 5 Years (2024-2028)
  • Hottest Housing Markets Predicted for 2024
  • Top 10 Hottest Real Estate Markets in the World
  • 10 Hottest Housing Markets That Are Booming – May 2024
  • Will the Housing Market Crash in 2025?
Filed Under: Housing Market, Real Estate Market Tagged With: Hottest Housing Markets, Housing Market, Real Estate Market

Midwest Housing Market: The Unexpected Trends You Won’t Believe

August 12, 2024 by Marco Santarelli

Midwest Housing Market: The Unexpected Trends You Won't Believe

As the national housing market faces fluctuations due to rising interest rates and economic uncertainties, the Midwest has emerged as a beacon of opportunity for homebuyers. With cities like Oshkosh, WI, gaining momentum, this region is becoming increasingly appealing for those seeking affordability and quality of life. Here is the report on trends and insights driving the heat in Midwest real estate markets and what it means for buyers and sellers alike (Realtor.com® Hottest Housing Markets rankings for July).

Midwest Housing Markets Are Heating Up: Trends and Insights

A Shift in Buyer Preferences

In recent years, the Midwest has attracted attention as individuals and families look for more budget-friendly housing options. As mortgage rates began to climb in 2022, many potential homebuyers felt discouraged by the high prices prevalent in coastal and urban markets. Consequently, buyers redirected their focus to Midwest areas, which offer more affordable options without sacrificing community and lifestyle.

Oshkosh, WI, has recently gained fame for being rated the hottest housing market in the country, but it is not alone. Other cities like Janesville, Green Bay, Rockford, and Akron have also made their mark on the national stage. These cities exemplify what makes the Midwest an attractive destination, highlighting affordability, accessibility, and a friendly atmosphere.

Rising Demand and Limitations in Inventory

The increased popularity of Midwest markets has led to a stark contrast between buyer demand and housing inventory. While the inventory of homes for sale improved by 24.2% year over year in Oshkosh, it still remains 72.8% lower than pre-pandemic levels. Such scarcity creates a highly competitive atmosphere, with homes often receiving multiple offers and selling well above the asking price.

Real estate agents in the region express the intense competition among buyers, which has prompted various tactics for standing out in the market. Strategies such as waiving home inspections, arranging appraisal gap coverage, and offering favorable terms to sellers have become common as buyers attempt to secure their desired properties.

Highlighting Other Hot Markets

In addition to Oshkosh, several other Midwest cities are experiencing notable growth. For instance, Janesville, WI, ranks as the ninth hottest market with a median home price of $335,000. This affordability, alongside its family-friendly environment and outdoor recreational opportunities, makes it an attractive choice for those looking to settle down.

Rockford, IL, with a median price of $216,000, also stands out, providing ample opportunities for first-time homebuyers. Meanwhile, cities like Akron, OH, and Canton, OH, continue to draw interest due to their low median prices and cost of living. As these cities gain traction, the Midwest is positioning itself as a viable alternative to the more competitive and often unaffordable coastal markets.

The Impact of Remote Work on Housing Demand

The pandemic has reshaped the landscape of work, with many companies adopting flexible remote work policies. As employees seek homes that align with their new work-from-home lifestyles, the appeal of living in picturesque, lower-cost locales is growing. The Midwest, with its charming towns, supportive communities, and natural beauty, becomes a desirable option for individuals and families looking to find a balance between work and life.

Conclusion: A Bright Future for the Midwest Real Estate Market

The ongoing heating up of Midwest housing markets signals a meaningful change in American real estate dynamics. As buyers increasingly prioritize affordability, accessibility, and quality of life, cities like Oshkosh, Janesville, and Rockford are set to thrive in the coming years.

For potential homebuyers, the Midwest offers a unique opportunity to invest in property that combines value and lifestyle, ensuring that this region remains a hot spot in the evolving housing market. As trends continue to shift and develop, the heartland of America is rapidly establishing itself as a leading destination for homebuyers and investors alike.


ALSO READ:

  • Housing Market 2024: Key Predictions for the Remainder of the Year
  • Real Estate Forecast Next 5 Years: Top 5 Predictions for Future
  • Housing Market Predictions for the Next 2 Years
  • Housing Market Predictions for Next 5 Years (2024-2028)
  • Hottest Housing Markets Predicted for 2024
  • Top 10 Hottest Real Estate Markets in the World
  • 10 Hottest Housing Markets That Are Booming – May 2024
  • Will the Housing Market Crash in 2025?

Filed Under: Housing Market, Real Estate Market Tagged With: Hottest Housing Markets, Housing Market, Real Estate Market

Oshkosh, WI Emerges as the Hottest Housing Market in the U.S.

August 12, 2024 by Marco Santarelli

In a remarkable turn of events for the housing market, Oshkosh, Wisconsin, has officially been crowned the hottest housing market in the United States for the first time ever, according to the latest Realtor.com® Hottest Housing Markets rankings for July 2024. Known more for its name shared with a popular children’s clothing brand—OshKosh B’Gosh—this Midwestern city is now in the spotlight due to its budget-friendly housing options and serene environment, attracting eager homebuyers in droves.

Oshkosh, WI Emerges as the Hottest Housing Market in the U.S.

Affordability Meets Desirability

With a median list price of $374,000, homes in Oshkosh are notably more affordable than the national median price, which stands at $439,950. This price difference of $65,950 has made Oshkosh an appealing option for buyers migrating from larger urban areas like Milwaukee, where housing costs can be significantly higher. Testimonials from local real estate professionals illustrate the mounting competition for homes in the area, as properties attract considerable interest and sell at a rapid pace.

“Oshkosh is a very nice town with a much lower cost of living than Milwaukee or the Upper Valley,” says Kate Schlagel-Grier, a local real estate agent with Berkshire Hathaway HomeServices. The allure of lower home prices, coupled with a family-friendly environment, has drawn many buyers looking to settle down without breaking the bank.

A Competitive Seller’s Market

Realtor.com’s data indicates that homes in Oshkosh received an astounding 3.7 times more views per property than the national average in July. The typical property spent just 18 days on the market before finding a buyer—32 days quicker than the national average of 50 days. Real estate agents have noted an uptick in multiple offers and bidding wars, reflecting the intense buyer demand in this scenic town.

Agent Chris Siamhof, also with Berkshire Hathaway, reports that her clients often employ creative strategies to make their offers more enticing. “Clients are waiving home inspections, offering appraisal gap coverage, letting owners rent back, or even paying the owner’s property taxes for a year—anything they can do to make their offers stand out,” she explains. The competitive landscape has even seen some homes selling for as much as $30,000 over the asking price, showcasing the fervor in the market.

The Appeal of a Midwestern Gem

Oshkosh's charm is not solely attributed to its affordability; the picturesque setting along Lake Winnebago enhances its desirability. The combination of outdoor recreational opportunities, a friendly community atmosphere, and a stable job market—partly fueled by the presence of OshKosh B’Gosh—creates a compelling narrative for potential homebuyers.

The city boasts improvements in housing inventory, with listings up 24.2% year over year. However, at the same time, the available homes remain well below pre-pandemic levels—72.8% fewer compared to before COVID-19—a trend that has propelled Oshkosh to the top of the housing rankings.

Summary: A Bright Future Ahead

The ascent of Oshkosh, WI, as the hottest housing market in the U.S. signals a significant shift in buyer priorities and market dynamics. As affordability becomes a driving factor in home purchases, more and more buyers are looking toward Midwestern cities like Oshkosh that offer a balance between cost and quality of life.

Whether you're a first-time buyer, an investor, or simply curious about the latest housing trends, Oshkosh stands out as a beacon of opportunity in today’s competitive real estate market—offering a unique blend of charm, affordability, and a strong community spirit that is hard to resist.


ALSO READ:

  • Housing Market 2024: Key Predictions for the Remainder of the Year
  • Real Estate Forecast Next 5 Years: Top 5 Predictions for Future
  • Housing Market Predictions for the Next 2 Years
  • Housing Market Predictions for Next 5 Years (2024-2028)
  • Hottest Housing Markets Predicted for 2024
  • Top 10 Hottest Real Estate Markets in the World
  • 10 Hottest Housing Markets That Are Booming – May 2024
  • Will the Housing Market Crash in 2025?

Filed Under: Housing Market, Real Estate Market Tagged With: Hottest Housing Markets, Housing Market, Real Estate Market

Household Spending Expectations Plunge to Lowest Level Since 2021

August 12, 2024 by Marco Santarelli

Household Spending Expectations Plunge to Lowest Level Since 2021

In July 2024, the Household Finance landscape reveals significant insights and changes in consumer expectations that could shape financial decisions across the country. The latest Survey of Consumer Expectations conducted by the Federal Reserve Bank of New York provides a glimpse into the financial outlook of households, illustrating a mixture of resilience and concern among consumers.

Household Spending Expectations Plunge to Lowest Level Since 2021

Current Economic Climate: A Snapshot

The economic environment has been increasingly characterized by adaptive consumer behavior. As we delve into the findings from the July 2024 survey, several key indicators stand out:

  • The median home price growth expectations remained steady at 3.0%, signaling stable anticipations in the housing market.
  • The median expected growth in household income also held firm at 3.0%. This consistency is noteworthy, considering income growth has fluctuated slightly, ranging between 2.9% and 3.3% since January 2023.

Spending Habits and Growth Expectations

Despite the optimistic views on income and home prices, consumer expectations regarding spending have taken a subtle downward turn:

  • Median household spending growth expectations fell by 0.2 percentage point to 4.9%, marking the lowest reading since April 2021. This decline suggests a cautious approach to discretionary expenditures among consumers.

Impacts on Consumer Behavior:

The reduction in spending expectations could be reflective of:

  • Increased consumer caution in light of rising living costs.
  • Economic uncertainty leading households to prioritize savings over spending.

Perceptions of Credit Access

One of the notable findings in this survey is the changing sentiment around credit accessibility:

  • In July, consumer perceptions regarding credit access deteriorated, with a growing share of households reporting it has become harder to obtain credit compared to a year ago.
  • Contrary to this decline, expectations for future credit availability improved slightly. The percentage of respondents who anticipate it will be harder to access credit in the coming year has decreased.

Financial Stability Concerns

Financial stability remains a critical issue, highlighted by perceptions of debt management:

  • The average perceived probability of missing a minimum debt payment over the next three months increased by 1.0 percentage point to 13.3%. This figure represents the highest reading since April 2020 and underscores the economic pressures faced, particularly among lower-income households.

Demographics at Risk:

The increase in payment default perceptions mostly affects:

  • Households with an annual income below $50,000.
  • Individuals holding a high school degree or less, who often face more financial strain amid rising costs.

Tax Expectations and Government Debt

Tax burden expectations shifted slightly:

  • The median expectation regarding a year-ahead change in taxes decreased by 0.3 percentage points to 4.0%. This change might signal an awareness of potential tax policy adjustments aimed at alleviating some of the financial strain imposed on households.
  • On government debt, the median year-ahead expected growth remained unchanged at 9.3%. A stable outlook on government debt indicates that consumers are unlikely to see drastic changes affecting their financial strategies related to taxes and public services in the near term.

Interest Rates and Savings Outlook

Attitudes toward savings and interest rates also showed signs of fluctuation:

  • The mean perceived probability that the average interest rate on savings accounts will be higher in 12 months decreased by 0.2 percentage points to 25.1%. This shift may suggest consumer skepticism about favorable interest rates in the near future.

Comparative Financial Situations: Current vs. Future

Interestingly, while perceptions of current financial situations have improved slightly, expectations for the year ahead have not mirrored this sentiment:

  • Households reported a slight increase in confidence regarding their current financial situations compared to last year.
  • However, expectations for future financial situations declined, with more households anticipating a worse financial state in one year.

Market Insights: Stock Prices and Economic Optimism

The survey also sheds light on consumer optimism surrounding investments:

  • The mean perceived probability that U.S. stock prices will be higher in 12 months saw a slight increase, ticking up 0.1 percentage point to 39.3%. This modest rise reflects a general sense of cautious optimism among investors.

Summary: Navigating Through Changes in Household Finance

The July 2024 Survey of Consumer Expectations highlights a complex interplay of optimism and caution among U.S. households. With steady expectations in income and home price growth juxtaposed against rising concerns over spending and credit access, consumers are navigating a delicate balance.

As households adjust their financial strategies in response to these insights, it becomes clear that while some economic indicators remain stable, underlying concerns about financial stability and affordability will continue to influence consumer behavior in the months ahead.

Encouragingly, the resilience displayed by many households suggests they are adapting to these changes, positioning themselves to weather potential economic storms.

For further detailed insights, you can refer to the Federal Reserve Bank of New York’s July 2024 Survey of Consumer Expectations.


ALSO READ:

  • Mixed Signals in US Economy: New Forecast Predicts Slower Growth
  • How Strong is the US Economy Today in 2024?
  • Economic Forecast: Will Economy See Brighter Days in 2024?
  • Will the Economy Recover in 2024?
  • Is the US Economy Going to Crash: Economic Outlook
  • How Close Are We to Total Economic Collapse?
  • Is the US Economy Going to Crash: Economic Outlook
  • Economic Forecast for Next 10 Years

Filed Under: Economy Tagged With: Economic Forecast, Economy, inflation, Jobs

Three-Year Inflation Expectations at Historic Low: NY Fed Survey

August 12, 2024 by Marco Santarelli

Three-Year Inflation Expectations at Historic Low: NY Fed Survey

In today's economy, inflation and the labor market are two sides of the same coin, significantly impacting each other in ways that define consumer behavior and overall economic health. As recent data from the Federal Reserve Bank of New York's July 2024 Survey of Consumer Expectations illustrate, recent trends in inflation expectations reveal a complex relationship with labor market conditions.

Three-Year Inflation Expectations at Historic Low: NY Fed Survey

The July 2024 Survey found that median one- and five-year-ahead inflation expectations remained stable at 3.0% and 2.8%, respectively. However, a noteworthy decline occurred in three-year-ahead inflation expectations, which fell by 0.6 percentage points to a series low of 2.3%. This decline is particularly significant among respondents with lower educational attainment and income levels, reflecting heightened economic anxieties among these demographics.

  • One-year inflation expectations: 3.0%
  • Five-year inflation expectations: 2.8%
  • Three-year inflation expectations: 2.3% (new series low)

This stability in long-term expectations contrasts with the short-term fluctuations seen in commodity prices, where expectations for gas prices declined by 0.8 percentage points to 3.5%, while the expectation for medical care costs increased by 0.2 percentage points to 7.6%. These fluctuations show how consumer sentiment can diverge based on specific goods and services, affecting household budgeting decisions.

Labor Market Insights

The labor market's dynamics appear to be shifting, as indicated by responses in the same survey. Median expected earnings growth for the year ahead dropped by 0.3 percentage points to 2.7%, suggesting a more cautious outlook among consumers regarding wage increases. This sentiment is essential as aggregate wage growth can influence inflation indirectly through consumer spending patterns.

In terms of job security, the survey revealed mixed results:

  • Mean probability of higher unemployment in the next year decreased to 36.6%.
  • Mean perceived probability of losing one's job dropped to 14.3%.
  • However, the mean perceived chance of finding a new job after losing one decreased to 52.5%, the lowest since early 2023.

These findings underline a growing concern regarding job security, particularly as job-seeking confidence appears to be waning. When workers feel less confident about securing new employment, it can lead to reduced spending, thereby putting downward pressure on inflation.

The Relationship Between Inflation and Labor Markets

The interplay between inflation rates and labor market conditions is multi-faceted. Higher inflation can erode purchasing power, leading consumers to tighten their budgets. This behavior typically results in reduced consumption, potentially slowing down economic growth and impacting the labor market.

Conversely, if wages do not keep pace with inflation, workers may feel increasingly pressured to demand higher salaries, leading to wage-price spirals. As seen in the July 2024 expectations, while inflation predictions have stabilized, consumer anxiety over earnings growth remains a concern.

Economic Theories in Play

Economists often discuss the Phillips Curve, which suggests an inverse relationship between inflation and unemployment. According to this theory:

  • Low unemployment typically leads to higher inflation as employers compete for fewer workers, driving up wages.
  • Conversely, when unemployment is high, inflation tends to fall as wage growth stagnates.

In the current economic climate, we see an apparent contradiction. While inflation expectations have stabilized, there is rising concern about job markets and wage growth, indicating the complexity of real-world economic scenarios.

Implications for Policymakers

For policymakers, understanding the nuances between inflation expectations and labor market trends is crucial. If inflation fears begin to dominate, it could lead the Federal Reserve to adopt more aggressive monetary tightening measures, like increasing interest rates. Conversely, if the labor market shows signs of distress without corresponding inflation, markets might react differently, requiring more nuanced policy interventions.

  • Central Bank Strategies: The Federal Reserve's approach will likely hinge on maintaining a balance between controlling inflation and supporting labor market recovery. As inflation expectations stabilize, continued attention will be needed regarding employment statistics to gauge overall economic health.

Key Takeaways

  1. Stabilized Inflation Expectations: Despite recent fluctuations in commodity prices, long-term inflation expectations show stability.
  2. Cautious Labor Market Outlook: Decreasing job-seeking confidence and expected earnings growth create a complex picture for workers.
  3. Economic Interdependence: Inflation and labor markets are deeply interconnected, making it essential for policymakers to monitor both closely.
  4. Consumer Behavior Impacts: Evolving consumer expectations and job market dynamics hold significant implications for market trends and economic policies.

By understanding the relationship between inflation and the labor market, stakeholders can make better-informed decisions that consider both consumer sentiments and monetary policy strategies.

For further detailed insights, you can refer to the Federal Reserve Bank of New York’s July 2024 Survey of Consumer Expectations.


ALSO READ:

  • Mixed Signals in US Economy: New Forecast Predicts Slower Growth
  • How Strong is the US Economy Today in 2024?
  • Economic Forecast: Will Economy See Brighter Days in 2024?
  • Will the Economy Recover in 2024?
  • Is the US Economy Going to Crash: Economic Outlook
  • How Close Are We to Total Economic Collapse?
  • Is the US Economy Going to Crash: Economic Outlook
  • Economic Forecast for Next 10 Years

Filed Under: Economy Tagged With: Economic Forecast, Economy, inflation, Jobs

  • « Previous Page
  • 1
  • …
  • 7
  • 8
  • 9
  • 10
  • 11
  • …
  • 13
  • Next Page »

Real Estate

  • Baltimore
  • Birmingham
  • Cape Coral
  • Charlotte
  • Chicago

Quick Links

  • Markets
  • Membership
  • Notes
  • Contact Us

Blog Posts

  • Dave Ramsey Predicts Mortgage Rates Will Probably Drop Soon in 2025
    May 11, 2025Marco Santarelli
  • Will the Bond Market Panic Keep Interest Rates High in 2025?
    May 11, 2025Marco Santarelli
  • Seattle Housing Market: Trends and Forecast 2025-2026
    May 11, 2025Marco Santarelli

Contact

Norada Real Estate Investments 30251 Golden Lantern, Suite E-261 Laguna Niguel, CA 92677

(949) 218-6668
(800) 611-3060
BBB
  • Terms of Use
  • |
  • Privacy Policy
  • |
  • Testimonials
  • |
  • Suggestions?
  • |
  • Home

Copyright 2018 Norada Real Estate Investments