Norada Real Estate Investments

  • Home
  • Markets
  • Properties
  • Membership
  • Podcast
  • Learn
  • About
  • Contact

Archives for August 2025

Hottest Housing Markets: Top ZIP Codes for 2025 Revealed

August 19, 2025 by Marco Santarelli

Hottest Housing Markets: Top ZIP Codes for 2025 Revealed

If you're trying to figure out where the hottest housing markets are right now, the answer is often found in the ZIP codes. The following top 10 ZIP codes in the U.S. showcase where buyer demand is highest and homes are selling the fastest. For 2025, the spotlight shines brightly on Beverly, Massachusetts (01915), along with other areas primarily in the Northeast and Midwest, highlighting a trend of buyers seeking value, location, and lifestyle.

Hottest Housing Markets: Top ZIP Codes for 2025 Revealed

Each year, I eagerly anticipate the Realtor.com's Hottest ZIP Codes report to get a pulse on the real estate market. It provides some serious insight into where people want to live and what they're prioritizing when buying a home. This year's report is especially interesting because it underscores how buyers are adapting to higher mortgage rates and affordability challenges. I've always believed that people are smart about where they put their money when it comes to real estate, and these ZIP codes tell a story of buyers strategically seeking value, even in competitive markets.

How Are The “Hottest ZIP Codes” Determined?

Realtor.com uses a unique methodology to identify these sought-after areas. I like how it combines two key factors so it is a well-rounded process:

  • Market Demand: Measured by the number of unique viewers per property on Realtor.com. The more people looking at a property, the hotter the market.
  • Pace of the Market: Measured by how long a listing stays active on Realtor.com. The faster homes sell, the more competitive the ZIP code becomes.

Basically, the hottest ZIP codes have high buyer interest (lots of views) and quick sales (homes don't stay on the market long). The below table lists the top 10 hottest ZIP codes of 2025.

Rank ZIP Code City
1 01915 Beverly, MA
2 08053 Marlton, NJ
3 01453 Leominster, MA
4 63021 Ballwin, MO
5 07470 Wayne, NJ
6 44149 Strongsville, OH
7 06611 Trumbull, CT
8 02864 Cumberland, RI
9 06074 South Windsor, CT
10 43209 Bexley, OH

Key Trends & Takeaways from the List

Here's what I found most interesting about this year's hottest ZIP codes report:

  • Northeast and Midwest Domination: For the third year in a row, the South and West are absent from the list. The Northeast and Midwest continue to see high demand and limited housing supply.
  • Suburban Appeal: The hottest ZIP codes are largely in desirable suburban areas, offering a slower pace of life without sacrificing access to major economic hubs.
  • Homes are Flying Off the (Virtual) Shelf: Listings in the top ten ZIPs are seeing 3.3 to 5.2 times as many views as the average U.S. property, and homes are selling 30–42 days faster.
  • Tight Inventory: Inventory is way down in these hot markets, almost 59% below pre-pandemic levels. This means more competition and faster sales for the properties that are listed.

The Top 10 Hottest Housing Markets by ZIP Code in 2025

Let's dive a little deeper into each of these top 10 ZIP codes and see what makes them so desirable:

  1. Beverly, MA (01915)
    • Metro Area: Boston-Cambridge-Newton, MA-NH
    • The most popular ZIP code in the U.S. for 2025.
    • Median Listing Price: $746,000
    • Days on Market: 16
    • Viewers per Property vs. US Average: 4.6x
    • Why it's hot: Good schools, coastal charm, and commuter rail access to Boston make Beverly a desirable option for those seeking a balance between suburban living and city access.
  2. Marlton, NJ (08053)
    • Metro Area: Philadelphia-Camden-Wilmington, PA-NJ-DE-MD
    • Median Listing Price: $495,000
    • Days on Market: 17
    • Viewers per Property vs. US Average: 3.9x
    • Why it's hot: Marlton offers a more affordable option compared to other areas in the Philadelphia metro, with good schools and a convenient location.
  3. Leominster, MA (01453)
    • Metro Area: Worcester, MA
    • Median Listing Price: $441,000
    • Days on Market: 18
    • Viewers per Property vs. US Average: 4.0x
    • Why it's hot: Leominster attracts buyers seeking a lower cost of living compared to Boston, while still having access to the city's amenities. Leominster is also well connected to the more popular Zip code of Boston.
  4. Ballwin, MO (63021)
    • Metro Area: St. Louis, MO-IL
    • Median Listing Price: $350,000
    • Days on Market: 22
    • Viewers per Property vs. US Average: 3.8x
    • Why it's hot: Good schools and a family-friendly atmosphere make Ballwin a popular choice in the St. Louis metro.
  5. Wayne, NJ (07470)
    • Metro Area: New York-Newark-Jersey City, NY-NJ
    • Median Listing Price: $664,000
    • Days on Market: 22
    • Viewers per Property vs. US Average: 3.3x
    • Why it's hot: Wayne offers a suburban lifestyle with a relatively shorter commute to New York City, making it a desirable option for those working in the city. This makes living easier and lifestyle, flexible.
  6. Strongsville, OH (44149)
    • Metro Area: Cleveland, OH
    • Median Listing Price: $423,000
    • Days on Market: 25
    • Viewers per Property vs. US Average: 5.2x
    • Why it's hot: Strongsville provides a family-friendly” environment with strong schools and access to the amenities of Cleveland.
  7. Trumbull, CT (06611)
    • Metro Area: Bridgeport-Stamford-Danbury, CT
    • Median Listing Price: $666,000
    • Days on Market: 25
    • Viewers per Property vs. US Average: 5.1x
    • Why it's hot: Trumbull balances suburban living with good schools and a reasonable commute to New York City.
  8. Cumberland, RI (02864)
    • Metro Area: Providence-Warwick, RI-MA
    • Median Listing Price: $534,000
    • Days on Market: 26
    • Viewers per Property vs. US Average: 3.6x
    • Why it's hot: Cumberland offers more affordable housing compared to Boston, with a good location near the city of Providence, making it especially suitable for renters.
  9. South Windsor, CT (06074)
    • Metro Area: Hartford-West Hartford-East Hartford, CT
    • Median Listing Price: $406,000
    • Days on Market: 27
    • Viewers per Property vs. US Average: 5.0x
    • Why it's hot: Good schools and a family-oriented community make South Windsor an attractive choice for those seeking a suburban lifestyle near Hartford.
  10. Bexley, OH (43209)
    • Metro Area: Columbus, OH
    • Median Listing Price: $439,000
    • Days on Market: 25
    • Viewers per Property vs. US Average: 3.4x
    • Why it's hot: Bexley is known for its historic charm, walkable streets, and good schools, attracting buyers looking for something special in Columbus. It also offers a small-town feel with easy access to metropolitan amenities.

The Value Proposition: What Buyers Want

It's interesting to me that even with higher mortgage rates, people are still willing to jump into the housing market in these areas. Why is that? Well, this year's hottest ZIP codes highlight what buyers are prioritizing:

  • Value for Money: Many buyers are looking for areas where they can get more house for their money compared to the surrounding metro area.
  • Suburban Lifestyle with Urban Access: People want the space and safety of the suburbs, but they still want to be able to easily get to the city for work or entertainment.
  • Good Schools: This is always a top priority for families with children.
  • Community: People want to live in neighborhoods where they feel connected to their neighbors and have a sense of belonging.

Big-City Buyers Seeking Suburban Appeal

It's also worth noting that a lot of the interest in these hottest ZIP codes is coming from people who already live in big cities. Buyers from metros like New York, Boston, and Washington, D.C., are looking to escape the high costs and fast pace of urban life, without completely giving up access to those cities. As someone who has lived in both urban and suburban areas, I completely understand this desire!

  • New York City was the top out-of-metro source in 3 of the mentioned ZIP codes.
  • Boston was the top out-of-metro source in 4 of the mentioned ZIP codes
  • Washington, D.C. was the top out-of-metro source in 2 of the mentioned ZIP codes.

These people on average earn 50% more than the national median, making them highly competitive.

Who are these Buyers?

The buyers in the areas with hottest housing markets also share a few common characteristics:

  • Higher-Income Households: The average household income in these ZIPs is around $114,000, much higher than the national average.
  • Good Credit Scores: The average credit score in these areas is 759, compared to 748 nationwide.
  • Larger Down Payments: Buyers in these ZIPs are putting down more money on their homes, likely to lower their monthly payments in this high-interest-rate environment.
  • Established Homeowners: The average age of homeowners in these areas is 56, older than the national average, suggesting more experience and financial stability.

What Does This Mean For You?

Whether you're a buyer or a seller, understanding these trends can help you make informed decisions.

  • For Buyers: If you're looking to buy in one of these hottest ZIP codes, be prepared for competition. Get pre-approved for a mortgage, work with a knowledgeable real estate agent, and be ready to move quickly.
  • For Sellers: If you're selling in one of these areas, you're in a good position. Work with an experienced agent who can help you price your home competitively and market it effectively to attract the most offers.

Final Thoughts

The hottest housing markets are always changing, but some things remain constant. People want a good quality of life, a convenient location, and a sense of community. If you can find a ZIP code that offers those things, you're likely to find a place where homes are selling quickly and prices are holding steady.

While this report gives us a snapshot of the hottest markets right now, it's always important to do your own research and consider your individual needs and priorities when making real estate decisions. I encourage you to explore these ZIP codes and others, talk to local residents and agents, and see if any of these areas might be a good fit for you.

 Invest in the Hottest Housing Markets of the U.S.

Discover high-quality, ready-to-rent properties designed to deliver consistent returns.

Contact us today to expand your real estate portfolio with confidence.

Contact our investment counselors (No Obligation):

(800) 611-3060

Get Started Now 

Recommended Read:

  • Top 10 Hottest Housing Markets Where Home Prices Are Soaring
  • Housing Predictions 2025 by Warren Buffett's Berkshire Hathaway
  • New Tariffs Could Trigger Housing Market Slowdown in 2025
  • Housing Market Forecast 2025: Affordability Crisis Will Continue
  • Lower Mortgage Rates Will Reignite the Housing Demand in 2025
  • NAR Predicts 6% Mortgage Rates in 2025 Will Boost Housing Market
  • Housing Market Forecast for the Next 2 Years: 2024-2026
  • Housing Market Predictions for the Next 4 Years: 2025 to 2028
  • Housing Market Predictions for Next Year: Prices to Rise by 4.4%
  • Housing Market Predictions for 2025 and 2026 by NAR Chief
  • Real Estate Forecast Next 5 Years: Top 5 Predictions for Future
  • 2008 Forecaster Warns: Housing Market 2024 Needs This to Survive
  • Real Estate Forecast Next 10 Years: Will Prices Skyrocket?

Filed Under: Housing Market, Real Estate Market Tagged With: Hottest Housing Markets, Housing Market, Housing Market Trends

Today’s Mortgage Rates – August 19, 2025: 30-Year FRM Rises by 5 Basis Points, Refi Rates Jump

August 19, 2025 by Marco Santarelli

Today's Mortgage Rates - August 19, 2025: 30-Year FRM and Refinance Rates Rise

On August 19, 2025, mortgage rates today show a slight increase in the average 30-year fixed mortgage rate to 6.72%, up by 2 basis points from 6.70% the previous day and 5 basis points from last week’s 6.67%, according to Zillow’s latest data. Meanwhile, refinance rates are also up, with the 30-year fixed refinance rate rising to 6.97%, a 5 basis points increase from yesterday and 6 basis points higher than last week.

However, not all rates moved upwards: the national average 15-year fixed mortgage rate decreased slightly to 5.76%, and the 5-year ARM mortgage rate dropped to 7.26%. This combination of mixed movement reflects ongoing market uncertainty tied to economic data and Fed policies.

Today's Mortgage Rates – August 19, 2025: 30-Year FRM Rises by 5 Basis Points, Refi Rates Jump

Key Takeaways:

  • 30-year fixed mortgage rate increased slightly to 6.72% (up 2 basis points from the previous day).
  • 30-year fixed refinance rate rose to 6.97%, up 5 basis points from yesterday and 6 basis points from last week.
  • 15-year fixed mortgage rate fell to 5.76%, down 5 basis points.
  • 5-year ARM mortgage rate decreased to 7.26%, down 7 basis points.
  • Experts predict mortgage rates will remain above 6% through 2025 and only dip below 6% in Q3 2026.
  • The Federal Reserve is expected to potentially cut interest rates in September 2025, which might lower mortgage rates in the coming weeks.

For detailed current rates, market drivers, and what these fluctuations mean for homebuyers and refinancers, read on.

Understanding Today’s Mortgage Rates on August 19, 2025

Mortgage rates are influenced by several factors, including inflation, employment data, Federal Reserve policies, and broader economic trends. On August 19, 2025, the average 30-year fixed mortgage rate sits at 6.72%, marginally higher than last week. This slow rise contrasts with some decreases seen in other products like the 15-year fixed mortgage and certain adjustable-rate mortgages (ARMs).

The modest uptick in the 30-year fixed mortgage rate reflects concerns about sticky inflation and ongoing economic uncertainty. Employment reports from early August showed weaker job growth, which generally cools inflation expectations but also signals slower economic expansion. Because mortgage rates closely follow bond yields tied to inflation and growth forecasts, these mixed signals are creating a somewhat volatile but narrow rate range around the mid-to-high 6% level.

Current Mortgage Rate Summary Table (August 19, 2025)

Mortgage Program Rate 1-Week Change APR 1-Week Change
30-Year Fixed 6.72% Up 0.05% 7.22% Up 0.10%
20-Year Fixed 6.43% Down 0.24% 6.90% Down 0.08%
15-Year Fixed 5.76% No change 6.08% Up 0.01%
10-Year Fixed 5.48% No change 5.84% No change
7-Year ARM 7.45% Down 0.08% 8.12% Up 0.12%
5-Year ARM 7.26% Up 0.02% 7.86% Up 0.05%

Source: Zillow Mortgage Rates Data, August 19, 2025

Refinance Rates Today – August 19, 2025

Refinance rates reflect opportunities for current homeowners to renegotiate their mortgages. As of today, the 30-year fixed refinance rate increased to 6.97%, climbing 5 basis points from the previous day and 6 basis points higher than last week’s 6.91%. The 15-year fixed refinance rate also moved up to 5.81%, an 8 basis points increase, and the 5-year ARM refinance rate jumped notably by 16 basis points to 7.82%.

Refinance Program Rate 1-Week Change APR 1-Week Change
30-Year Fixed Refinance 6.97% Up 0.06% N/A N/A
15-Year Fixed Refinance 5.81% Up 0.08% N/A N/A
5-Year ARM Refinance 7.82% Up 0.16% N/A N/A

Source: Zillow Refinance Rates Data, August 19, 2025

Economic Factors Affecting Mortgage and Refinance Rates

The higher rates seen in both mortgage and refinance markets recently are influenced by a few key elements:

  • Weak Job Growth and Inflation: Early August’s weak job growth figures tempered expectations for rapid economic expansion but inflation remains somewhat sticky, meaning it is still above comfortable levels. This combination is causing investors to reassess interest rate expectations.
  • Federal Reserve Activity: The Federal Reserve had held rates steady through several meetings in 2025 after aggressive hikes from 2022 to 2023. Recently, the Fed’s signals suggest possible interest rate cuts soon, especially after the July job report showed a slowing economy. The CME FedWatch tool currently shows about a 91% chance of a 0.25% cut by September 2025, which would likely help push mortgage rates down.
  • Long-Term Inflation Risks: Despite expectations for cuts, inflation risks remain, partly due to tariffs and supply chain constraints, which keep interest rates elevated.

The Federal Reserve’s Role and Forecast for Mortgage Rates

The Federal Reserve has a significant influence on mortgage rates through its decisions on the federal funds rate and monetary policy signals.

From 2021 through 2023, the Fed increased rates aggressively to combat inflation, pushing mortgage rates to 20-year highs. By late 2024, the Fed started cutting rates, but these have mostly paused in 2025 as they assess economic data.

Looking ahead:

  • Analysts at the Mortgage Bankers Association and Fannie Mae forecast rates to hover in the 6.4% to 6.8% range through the rest of 2025.
  • The Fed’s next key meetings in mid-September and December 2025 will be critical for rate movement.
  • The Fed aims to reduce rates slowly, potentially lowering the cost of borrowing toward 6% by late 2025 or 2026.
  • Market factors remain fluid, so mortgage rates could fluctuate based on economic developments.

How Do Today’s Rates Affect Borrowers?

  • For homebuyers, the current 30-year fixed mortgage rate at 6.72% means higher monthly payments compared to recent years but stable within the current range. Buyers should consider their own financial situations and not expect immediate rate drops, though modest declines may occur if the Fed cuts rates next month.
  • For refinancers, the increase to 6.97% for 30-year fixed refinance loans signals caution. Those with very high existing rates (above 7%) might wait for potential Fed rate cuts, but the timing is uncertain. Shorter-term refinance options, like 15-year fixed or ARM products, may offer alternatives.


Related Topics:

Mortgage Rates Trends as of August 18, 2025

Mortgage Rates Predictions Next 90 Days: August to October 2025

Mortgage Rates Predictions for the Next 60 Days

Mortgage Rates Predictions for Next 90 Days: July-Sept 2025

Example Calculation: Monthly Mortgage Payment at Today’s Rates

If you take out a $300,000 mortgage with a 30-year fixed interest rate of 6.72%, your monthly payment for principal and interest would be about $1,937.

If the interest rate were a bit lower, say 6.0%, your monthly payment would drop to around $1,799.

That means by getting the lower rate, you’d save about $138 every month on your mortgage payment.

Forecast Summary: What Experts Say

  • National Association of REALTORS® expects average mortgage rates to settle around 6.4% in H2 2025 and dip further to 6.1% in 2026.
  • Fannie Mae forecasts that mortgage rates won’t drop below 6% until Q3 2026.
  • Realtor.com predicts a slow easing of rates to around 6.4% by year-end 2025.
  • The Mortgage Bankers Association expects rates to mostly stay near current levels, ending 2025 around 6.7% and moving toward 6.3% in 2026.

Broader Context: Why Rates Are Staying Elevated Longer Than Expected

Many predicted mortgage rates would fall over the past year, but rates have instead climbed. This is primarily due to persistent inflation and economic factors that kept the Federal Reserve cautious in cutting rates quickly.

This reality highlights why timing the market perfectly is challenging. Borrowers are often better off focusing on their personal financial readiness rather than trying to predict rate movements precisely.

Capitalize Amid Rising Mortgage Rates

With mortgage rates expected to remain high in 2025, it’s more important than ever to focus on strategic real estate investments that offer stability and passive income.

Norada delivers turnkey rental properties in resilient markets—helping you build steady cash flow and protect your wealth from borrowing cost volatility.

HOT NEW LISTINGS JUST ADDED!

Speak with a seasoned Norada investment counselor today (No Obligation):

(800) 611‑3060

Get Started Now

Also Read:

  • Will Mortgage Rates Go Down in 2025: Morgan Stanley's Forecast
  • Mortgage Rate Predictions 2025 from 4 Leading Housing Experts
  • Mortgage Rate Predictions for the Next 3 Years: 2026, 2027, 2028
  • 30-Year Fixed Mortgage Rate Forecast for the Next 5 Years
  • 15-Year Fixed Mortgage Rate Predictions for Next 5 Years: 2025-2029
  • Will Mortgage Rates Ever Be 3% Again in the Future?
  • Mortgage Rates Predictions for Next 2 Years
  • Mortgage Rate Predictions for Next 5 Years
  • Mortgage Rate Predictions: Why 2% and 3% Rates are Out of Reach
  • How Lower Mortgage Rates Can Save You Thousands?
  • How to Get a Low Mortgage Interest Rate?
  • Will Mortgage Rates Ever Be 4% Again?

Filed Under: Financing, Mortgage Tagged With: Interest Rate, mortgage, Mortgage Rate Trends, mortgage rates, Mortgage Rates Today

Austin Housing Market: Trends and Forecast 2025-2026

August 18, 2025 by Marco Santarelli

Austin Housing Market: Trends and Forecast 2025-2026

Thinking about buying, selling, or just curious about what's happening in the Austin housing market? You're in the right place. The Austin real estate market is currently showing signs of stabilization with median sales prices remaining flat compared to the previous year, but inventory is significantly up. Let's dive into the specifics to give you a better understanding of the current trends.

Austin Housing Market Trends in 2025:

Key Takeaways from the June 2025 Austin Housing Market Report

Based on the latest data from Unlock MLS & ABoR, here's a snapshot of what's happening:

  • Median Sales Price: $449,900 (No Change Year-over-Year)
  • Closed Sales: 2,823 (Up 2.8% Year-over-Year)
  • Sales Dollar Volume: $1.65 Billion (Up 4.5% Year-over-Year)
  • Months of Inventory: 5.5 Months (Up 0.7 Months Year-over-Year)
  • New Listings: 4,562 (Up 4.8% Year-over-Year)
  • Active Listings: 15,360 (Up 18.2% Year-over-Year)
  • Pending Sales: 2,706 (Up 3.5% Year-over-Year)
  • Average Days on Market: 72 Days (Up 18 Days Year-over-Year)
  • Average Close to List Price: 93.9% (Compared to 94.8% in June 2024)

Digging Deeper: Analyzing the Numbers

Let's break down what these numbers really mean for you:

1. Home Price Stability (For Now):

The fact that the median sales price hasn't changed compared to last year is significant. After the crazy price spikes we saw in recent years, this suggests that prices have plateaued, at least temporarily. From my perspective, this is a welcome sign of normalization. The frenzied bidding wars seem to be cooling off, giving buyers a bit more breathing room.

2. More Homes to Choose From:

One of the most noticeable shifts is the substantial increase in active listings (up 18.2%). This means buyers have far more options than they did a year ago. Remember when it was practically impossible to find a house, good or bad, that the banks had not already grabbed? Sellers can't automatically expect to get top dollar anymore.

3. Inventory is Rising:

The climb to 5.5 months of inventory reflects the increased number of homes on the market. The concept of inventory is pretty simple: it represents the time, expressed in months, it would take to sell all the homes currently listed for sale, assuming no new listings come to market. A higher inventory can indicate a buyer's market. This means that, statistically, buyers have some leverage. From my perspective, the sweet spot for a balanced market is usually around 6 months of inventory.

4. Sales Activity:

The rise in closed sales, though modest at 2.8%, hints at a stable level of demand. Also, the slight increase in pending sales (up 3.5%) hints at a level of ongoing buyer interest.

5. Time on Market:

The average days on market have increased significantly. This aligns with the increased number of listings.

6. Sales Volume:

As we see a substantial rise of 4.5 percent year-over-year in sales volume, this rise is driven by a combination of factors:

  • An increase in the number of houses that have been sold
  • Higher average sales prices as compared to the previous year

7. List price vs. Closed price:

As we see a decline in the percentage of original list price, buyers are able to negotiate better deals now.

What's Driving These Trends?

Several factors are influencing the Austin housing market right now:

  • Interest Rates: Mortgage rates play a huge role. As rates fluctuate, it directly impacts affordability and buyer demand. I personally feel like rate stability will be a key factor in shaping the market's direction.
  • Job Growth: Austin's booming job market has been a major driver of housing demand. While growth may be moderating slightly, the influx of new residents continues to put pressure on housing.
  • Construction: New construction is adding more supply to the market, which can help moderate price increases. However, construction timelines and material costs can be unpredictable.
  • Economic Conditions: Overall economic health, both nationally and locally, influences buyer confidence and willingness to invest in real estate. Any economic uncertainty generally causes buyers to pause, which further slows down the market.

My Take on the Austin Market

Here's my personal perspective, based on my years of experience in the Austin market:

The Austin housing market is in a period of transition. The days of runaway price growth seem to be behind us, at least for now. We're moving towards a more balanced market, where buyers have more choices and sellers need to be more strategic.

I believe that rising inventory will continue to be a key theme. As more homes come on the market, buyers will have more power to negotiate. This doesn't necessarily mean prices will crash, but it does mean that sellers need to be realistic about pricing their homes competitively.

It's vital to remember that real estate is local. What's happening in one neighborhood might be very different from another. Factors like school districts, proximity to amenities, and the type of housing stock all play a role.

For Buyers:

Don't feel rushed. Take your time to find the right property and negotiate the best possible deal. Get pre-approved for a mortgage so you know your budget and can move quickly when you find the perfect home. Work with a knowledgeable real estate agent who understands the Austin market and can help you navigate the process.

For Sellers:

Price your home strategically based on current market conditions. Don't overprice it, or it will sit on the market. Make sure your home is in top condition. Buyers have more choices, so presentation matters. Be prepared to negotiate. Buyers may be looking for concessions like closing cost assistance or repairs.

Austin Housing Market Forecast 2025-2026: What to Expect?

Here's the scoop: the Austin housing market forecast suggests a continued slight dip in home values. While not a crash, expect a gradual decrease in the near term. I'll break down the latest predictions and what they mean for you.

Right now, the average home value in the Austin-Round Rock area is around $451,858. That's according to credible real estate sources, and it shows a 5.1% decrease over the past year. So, prices have already cooled off a bit.

What the Experts are Saying: The Forecast

Let's dive into what the data is telling us. Zillow has some specific forecasts for the Austin area, and here's a simplified look at them:

Area May 2025 Home Value Change
Austin, TX -0.8%
Dallas, TX -0.6%
Houston, TX -0.3%
San Antonio, TX -0.4%
McAllen, TX -0.2%
El Paso, TX 0%
Killeen, TX -0.2%
Corpus Christi, TX -0.4%
  • Near Term (June 2025): Zillow predicts a further 0.8% decrease in home values.
  • Mid Term (August 2025): The forecast indicates an additional 2.4% decrease.
  • One-Year Outlook (May 2025 to May 2026): Over the next year, Zillow is projecting a decrease of around 4.2%.

As you can see, the data suggests that the housing market correction is not only real, but also expected to persist. This could be great news if you are looking to buy a house for yourself, as you may get better deals to buy a home. However, if you are looking to sell a property, then you might have to reconsider your plans.

How does Austin compare to other Texas cities?

Take a look at the forecast for other major Texas metros:

City June 2025 Forecast August 2025 Forecast May 2026 Forecast
Dallas -0.6% -1.5% -2.2%
Houston -0.3% -0.7% -1.8%
San Antonio -0.4% -1.2% -3.2%
Austin -0.8% -2.4% -4.2%

Austin seems to be experiencing a slightly more significant correction compared to other major cities in Texas. However, let's not worry too much, as this is only a Zillow forecast. The price movement is only determined by demand and other circumstances.

National Trends: What's Happening Across the US?

It’s also worth considering the national housing picture to contextualize the Austin housing market forecast. Lawrence Yun, the Chief Economist for the National Association of Realtors (NAR), has a more positive outlook. Here's what he expects:

  • Existing Home Sales: Up 6% in 2025 and 11% in 2026.
  • New Home Sales: Up 10% in 2025 and 5% in 2026.
  • Median Home Prices: Up 3% in 2025 and 4% in 2026.
  • Mortgage Rates: Averaging around 6.4% in the second half of 2025, and settling around 6.1% in 2026.

These national trends suggest a potential recovery and stabilization in the broader housing market, so hopefully Austin will follow suit too.

Will Austin Housing Prices Crash? And What About 2026?

Based on the data, a full-blown crash in Austin seems unlikely. Instead, we're looking at a continued, gradual correction. Demand in Austin is still high, and the economy is relatively strong.

As for 2026, it's tough to say for sure, but if national trends hold true, we might see a slight increase in Austin home values. However, this would likely be modest, more in line with inflation and normal market growth.

My Two Cents

Predicting the future is always tricky, but here are a few things I'm watching closely:

  • Continued Inventory Growth: I expect inventory to continue to rise in the coming months, giving buyers even more options.
  • Moderating Price Growth: While I don't expect prices to plummet, I do think we'll see slower price growth than we've seen in recent years.
  • Increased Negotiation: Buyers will have more leverage to negotiate, so sellers need to be prepared to make concessions.
  • Focus on Value: Buyers will be more discerning and will prioritize value and quality over simply getting into the market.

I live and breathe this market, and based on what I'm seeing, I think a balanced approach is key. If you're a buyer, take advantage of the current dip and find a property that fits your needs. If you're a seller, be realistic about pricing and be prepared to negotiate. The Austin real estate market remains desirable in the long term, but it's undergoing a shift towards a more sustainable pace.

Is the Austin Housing Market Still Overpriced?

If you're thinking about buying a house in Austin, you're likely wondering: is the market overpriced? The answer, like most things in real estate, isn't a simple yes or no. Let's dive into the data and see what it tells us.

There's no doubt Austin's housing market has been on fire. A strong local economy, booming population, and influx of out-of-state buyers have sent home prices soaring. Studies show Austin homes are among the most overvalued in the nation, with buyers paying well above what the house might be worth based on traditional factors. Boise, Idaho, is the only city with a higher premium!

Before you write off Austin completely, consider this: compared to other major cities, Austin can still be affordable. While the median price tag is high compared to its own history, it's lower than giants like San Francisco or Los Angeles. Austin's cost of living is also generally lower, making homeownership a more realistic goal for some buyers.

Looking ahead, experts are bullish on Austin's long-term prospects. The city's strong and diverse economy is less likely to take a tumble in a downturn, and the growing population suggests continued demand for housing. This could mean your investment appreciates over time.

So, is Austin overpriced? It depends on your perspective and priorities. If affordability is your main concern, the high prices might be a hurdle. But for those seeking a long-term investment in a vibrant city with a healthy economy, Austin could be a good fit.

The most important factor? Understanding your own financial situation and goals. Carefully evaluate your budget and long-term plans before deciding to buy in Austin, or any market for that matter. Don't be afraid to crunch the numbers and talk to a financial advisor to make sure your dream home doesn't turn into a financial nightmare.

Are There Signs of a Housing Bubble in Austin?

While discussions about a housing bubble are common, Austin's current market dynamics suggest a more nuanced reality. While home prices have surged drastically over recent years, the recent market corrections do not necessarily indicate a bubble that is about to burst. Instead, the recent declines signal a recalibration of values within the market.

Economic fundamentals such as strong job growth, diverse industries, and lasting demand for housing help support the market long-term. Nevertheless, potential buyers and investors should remain vigilant and conduct thorough market analysis to understand both local and national economic indicators that could influence Austin's real estate landscape.

Which Neighborhoods in Austin Are Seeing the Most Growth or Decline?

Certain neighborhoods in Austin are emerging as hot spots for growth, driven by ongoing development and lifestyle appeal. Areas like North Austin and East Austin have gained popularity among younger buyers and families due to their vibrant culture, accessibility, and amenities.

Conversely, some traditionally desirable neighborhoods are witnessing slower sales, primarily due to higher prices and mature markets that may not offer much in terms of new inventory. Identifying which neighborhoods are growing or declining entails paying attention to broader market trends, demographic shifts, and the availability of amenities that cater to emerging buyer preferences.

Is Austin Still Attracting Out-of-State Buyers?

Austin continues to attract a significant number of out-of-state buyers, drawn by its dynamic economy, quality of life, and cultural offerings. Although there have been fluctuations in migration trends, the city’s reputation as a tech hub and cultural hotspot maintains its allure for many relocating from states like California, New York, and Illinois.

This influx adds layers to the housing demand, as newcomers seek to take advantage of Austin's unique lifestyle and employment opportunities. As long as the city retains its appeal, it is likely to continue attracting out-of-state buyers, contributing to both local market vitality and growth challenges.

What Impact is Austin's Job Market Having on Housing Demand?

Austin's robust and diverse job market plays a significant role in driving housing demand. Tech industries, educational institutions, and healthcare services provide stable employment opportunities that continue to attract new residents. With companies expanding and relocating to the area, the demand for housing—both for purchase and rental—remains strong.

Additionally, job seekers and young professionals are increasingly drawn to the city's innovative landscape, further fueling residential demand. As long as Austin's economic climate remains favorable, the impact on housing demand is likely to persist, keeping the market dynamic and competitive.

Should You Invest in the Austin Real Estate Market?

Austin's rapidly expanding economic industry is driving more people into the city which is increasing the housing demand. A number of reasons have affected the present situation of the Austin housing market, one of which is the high migration of firms and persons relocating to the city from Texas and out-of-state, which has led to a robust and varied economy that attracts people seeking opportunity.

A surge of people moving in, combined with rapid population growth and low mortgage interest rates, has turned Austin and its surrounding area into a sellers' market. Austin’s engine of job and population growth is not projected to slow down anytime soon—the biggest drivers of residential real estate demand. Its economy has diversified and strengthened over the past two decades.

Companies like Google and Tesla are moving operations to Austin. The software giant Oracle has also relocated its headquarters here. As more companies move here, that means more people looking for homes, and the city is also attractive to outside investors. With a steady influx of job creation in the pipeline, the housing market will continue to post strong numbers. Big companies moving here will also play into what happens to the housing market.

If you're considering real estate investment, Austin, Texas, is a city that should be on your radar. Known for its vibrant culture, strong economy, and population growth, Austin offers numerous opportunities for real estate investors. Let's explore in detail why Austin is a promising destination for real estate investment.

Population Growth and Trends

Population Growth:

  • Austin has been experiencing consistent and substantial population growth for many years. The city's population has been steadily increasing, making it one of the fastest-growing metropolitan areas in the United States.
  • The city's appeal to newcomers is driven by factors like its vibrant tech scene, cultural attractions, and overall quality of life.

Trends:

  • The population growth trend in Austin is expected to continue, with projections indicating a significant increase in residents over the coming years.
  • As the city's population expands, the demand for housing, both rental and owned, is likely to rise, creating opportunities for real estate investors.

Economy and Jobs

Economic Strength:

  • Austin's economy is robust and diverse, with a thriving technology sector, a burgeoning startup scene, and a strong presence of major corporations.
  • The city consistently ranks high in terms of job creation and economic growth, making it an attractive destination for professionals seeking employment opportunities.

Job Market:

  • The city's job market is diverse and dynamic, with a focus on technology, healthcare, education, and entertainment.
  • Employment opportunities continue to draw individuals to Austin, contributing to the population growth and housing demand.

Livability and Other Factors

Livability:

  • Austin consistently receives high marks for its quality of life. The city offers a vibrant cultural scene, excellent healthcare facilities, and access to outdoor activities.
  • It's known for its music and arts culture, making it a desirable place to live for professionals and creatives.

Education:

  • Austin is home to top-tier educational institutions, including the University of Texas at Austin. This draws students, academics, and their families to the city, further boosting the demand for housing.

Infrastructure:

  • The city has invested in infrastructure and transportation improvements to accommodate its growing population, making it more accessible and commuter-friendly.

Austin Rental Property Market Size and Growth

Rental Market:

  • Austin's rental property market is substantial and continues to grow. The city offers a wide range of rental properties, from apartments to single-family homes, catering to a diverse tenant population.
  • The city's dynamic job market attracts young professionals, making it an ideal location for rental property investment.

Growth Potential:

  • The city's population growth and job market strength contribute to the growth potential of the rental property market. As more people move to Austin, the demand for rental units is expected to rise.
  • Investors can explore various rental strategies, including long-term leases, short-term rentals, and vacation rentals, to diversify their real estate portfolio.

Other Factors Related to Real Estate Investing

Investor-Friendly Environment:

  • Austin's business-friendly environment extends to real estate investment. The city offers attractive incentives and a favorable legal framework for real estate investors.
  • Real estate investors benefit from a strong property rights regime and a well-regulated market.

Tax Benefits:

  • Texas does not have a state income tax, which can be advantageous for investors looking to maximize their returns.
  • Investors should explore the tax implications of specific investment strategies, including property taxes and capital gains.

Market Resilience:

  • Austin's real estate market has shown resilience during economic downturns, and it is considered one of the more stable markets in the country.
  • Investors appreciate the market's ability to weather economic fluctuations and maintain its growth trajectory.

Diversification:

  • Investors can diversify their portfolios by exploring various types of real estate, from residential properties to commercial and mixed-use developments, taking advantage of Austin's growing and diverse market.

As a real estate investor, Austin's population growth, strong economy, livability, rental property market size, and other investor-friendly factors make it a compelling choice. However, it's essential to conduct thorough market research, consult with local real estate experts, and tailor your investment strategy to your specific goals and risk tolerance. Austin's real estate market offers exciting opportunities, but informed decision-making is key to success.

Recommended Read:

  • Austin Real Estate Market Forecast 2025 to 2030
  • Is The Austin TX Housing Market in Big Trouble?
  • Will the Austin Housing Market Crash in 2024?
  • Is the Austin Housing Market Shifting? Here's What Experts Say
  • Austin House Prices Are ‘Going Back To Normal’
  • Austin Housing Market is Losing Homebuyers to Other Cities

Filed Under: Housing Market, Real Estate Market Tagged With: Austin, Housing Market

California Housing Affordability Drops in Q2 2025 Amid High Mortgage Rates

August 18, 2025 by Marco Santarelli

California Housing Affordability Drops in Q2 2025 Amid High Mortgage Rates

The dream of homeownership in California took a slight hit in the second quarter of 2025, with affordability dipping compared to the first quarter. This means fewer households could afford to buy a median-priced home this past quarter. However, it's not all doom and gloom; looking back a full year, things have actually improved slightly.

These numbers from the California Association of Realtors (C.A.R.) don't entirely surprise me. We're seeing a familiar tug-of-war between rising home prices and the persistent specter of elevated interest rates. While the quarter-over-quarter dip is a concern for many prospective buyers, the year-over-year gain offers a glimmer of hope that the market might be stabilizing, albeit slowly.

California Housing Affordability Dips in Second-Quarter 2025, But Signs of Improvement Remain

The Numbers Don't Lie: A Closer Look at Affordability

Let's break down what these figures really mean for the average Californian. In the second quarter of 2025, only 15% of California households had the financial muscle to purchase the median-priced home, which was pegged at a staggering $905,680. This is a step back from the 17% who could afford it in the first quarter of 2025. To make those monthly payments, including principal, interest, taxes, and insurance (often called PITI), you'd need a solid $232,400 annual income, translating to a monthly payment of about $5,810.

On the condo and townhome front, things are a little better, but still tough. Twenty-five percent of home buyers could swing a median-priced condo or townhome at $670,000. This required a minimum annual income of $172,000, with monthly payments around $4,300. While this is an improvement from the 22% in the second quarter of 2024, it still represents a significant financial hurdle for many.

Why the Dip? Interest Rates and Price Tag Tango

So, what's behind this slowdown in affordability? The report from C.A.R. points to two main culprits: elevated interest rates and higher home prices. Even though the effective interest rate saw a slight dip to 6.90% in the second quarter of 2025 from 6.93% in the first quarter, and was down from 7.10% a year ago, it's still a significant increase compared to the ultra-low rates we saw a few years back. This means borrowing that much money is considerably more expensive.

Think about it: that extra fraction of a percent on a mortgage over 30 years adds up to thousands, even tens of thousands, of dollars more in interest paid. My own clients often express frustration, noting that even with a bit more income, the higher interest rates simply push them out of their desired price range.

The median price of a single-family home also jumped 6.9% from the first quarter of 2025. Although the report mentions a year-over-year decrease for the first time in eight quarters – a truly encouraging sign – the sequential jump is what's contributing to the quarterly affordability dip. It’s a complex market, indeed.

A Flicker of Hope: Year-Over-Year Improvement

Now, for the brighter side of the story. When we compare the second quarter of 2025 to the same period in 2024, California’s housing affordability has indeed improved. Back then, only 14% of households could afford a median-priced home. This year-over-year increase, though small, is significant. It suggests that while the immediate quarter was tougher, the market is showing resilience and a potential for future improvement.

This year-over-year gain is largely thanks to mortgage rates cooling down from their peak and, in some areas, a slight moderation in home prices. The C.A.R. report accurately highlights that for the first time in eight quarters, California saw a year-over-year decrease in home prices. This is a crucial detail that indicates the frenzy of price hikes might be cooling off, which is essential for long-term affordability.

The National Picture: California Still Out of Reach

It’s always useful to see how we stack up against the rest of the country. Nationwide, 34% of households could afford the median-priced home of $429,400 in the second quarter of 2025. This required an annual income of $110,400. While this also saw a dip from the previous quarter, it’s a significant climb from the 33% recorded in the second quarter of 2024.

The stark difference is clear: the minimum income needed to afford a home in California is more than double that required nationally. This isn't just a slight gap; it’s a chasm that highlights the unique challenges of the California housing market. My conversations with clients who are relocating from other states often revolve around this very disparity – the sheer cost of entry into the California dream.

County-by-County Breakdown: A Patchwork of Affordability

California's housing market isn't a monolith; it's a diverse collection of regional economies and housing markets. The report provides a granular look at this, and the variations are striking.

Key Takeaways from the County Data:

  • Affordability declined in 23 counties compared to the previous quarter, remaining unchanged in 14.
  • Despite higher prices, 16 counties saw affordability improve quarter-over-quarter due to lower mortgage rates and higher incomes in those specific areas.
  • When looking year-over-year, affordability improved in 41 counties, while 12 saw declines or no change. This reinforces the notion of a broader, though uneven, trend towards better affordability compared to last year.

The Most and Least Affordable Counties:

  • Lassen County remains the most affordable, with 46% of households able to afford the median-priced home. It also boasts the lowest qualifying income at just $73,200.
  • Glenn County (39% affordability) and Tuolumne County (38% affordability) also show high levels of accessibility.
  • On the flip side, Mono County is the least affordable, with only 8% of households able to buy the median-priced home. It requires an income of $232,800 to do so.
  • Monterey and Santa Barbara counties follow closely at 10% affordability.
  • The pricey San Francisco Bay Area continues to dominate the most expensive listings. San Mateo County demands the highest qualifying income at $564,800 for a median-priced home. Santa Clara ($548,800) and San Francisco ($459,200) are not far behind.

This county-level data is crucial for anyone looking to buy. It underscores the importance of understanding specific local market dynamics. A buyer in Lassen County faces entirely different financial realities than someone trying to purchase in San Mateo.

Looking Ahead: What Does the Future Hold?

The report offers some forward-looking insights that are worth considering. They expect interest rates to ease further in the coming six months, predicting a continued slowdown in the economy. This is good news for potential homebuyers, as lower rates directly translate to lower monthly payments.

However, there's a caveat: tariffs could lead to increased consumer prices and inflation. This creates a tricky situation for the Federal Reserve, which will have to balance controlling inflation with supporting job growth. If inflation heats up, it could lead to interest rates staying higher for longer, potentially negating some of the expected affordability improvements.

From my perspective on the ground, I'm seeing a market that is still very much in flux. Sellers are adjusting their expectations, and buyers are becoming more strategic. We're not in a buyer's paradise by any stretch of the imagination, but we're also moving away from the extreme seller's market of a few years ago.

The expectation of moderating home prices in the coming months, especially as the market cools after the spring buying season, is something I'm hearing from many of my colleagues as well. This, combined with potentially lower interest rates, could indeed lead to a noticeable uptick in affordability by the end of 2025.

The Ongoing Challenge: Beyond the Numbers

It's important to remember that these affordability indexes are based on statistical averages. They don't capture the full emotional and practical realities of buying a home. The stress of saving for a down payment, the competition for desirable properties, and the sheer uncertainty of the market can be overwhelming for many.

As a seasoned observer of this market, I understand that even when the numbers say a home is affordable, the journey to getting there is often a long and arduous one. The dream of homeownership in California is a potent one, driving many to make significant sacrifices. It's our job as industry professionals and, for those who are interested, as informed consumers, to understand the trends and navigate them as effectively as possible.

The California housing affordability dips in second-quarter 2025 is a data point, a snapshot in time. While it presents immediate challenges, the underlying trends and future predictions suggest that the market is slowly but surely working towards a more balanced and, hopefully, more accessible future for aspiring homeowners.

“Invest in Real Estate in the Growing Markets”

Discover high-quality, ready-to-rent properties designed to deliver consistent returns.

Contact us today to expand your real estate portfolio with confidence.

HOT NEW LISTINGS JUST ADDED IN MULTIPLE MARKETS!

Contact our investment counselors (No Obligation):

(800) 611-3060

Get Started Now

Related Articles:

  • California Housing Market Rebounds After a Three-Month Slump in Sales
  • Is the California Housing Market Heading for a Crash or Correction?
  • California Housing Market: Forecast and Trends 2025-2026
  • California Housing Market Graph 50 Years
  • The Great Recession and California's Housing Market Crash: A Retrospective
  • California Dominates Housing With 7 of Top 10 Priciest Markets
  • Real Estate Forecast Next 5 Years California: Boom or Crash?
  • Anaheim, California Joins Trillion-Dollar Club of Housing Markets
  • California Housing Market: Nearly $174,000 Needed to Buy a Home
  • Most Expensive Housing Markets in California
  • Abandoned Houses for Free California: Can You Own Them?
  • California Housing in High Demand: 19 Golden State Cities Sizzle
  • Homes Under 50k in California: Where to Find Them?
  • Will the California Housing Market Crash?
  • California Housing Market Crash: Is a Correction Coming Up?

Filed Under: Growth Markets, Housing Market, Real Estate Market Tagged With: california, Housing Market

Today’s Mortgage Rates – August 18, 2025: Fixed Rates Climb, 30-Year FRM Rises by 2 Basis Points

August 18, 2025 by Marco Santarelli

Today's Mortgage Rates - August 18, 2025: Fixed Rates Climb, 30-Year FRM Rises by 2 Basis Points

As of August 18, 2025, mortgage rates have inched slightly higher this week. According to Zillow, the national average for a 30-year fixed mortgage rate climbed from 6.67% to 6.69%, though refinance rates have edged down by a few basis points. Rates remain stubbornly above 6% with experts forecasting gradual declines, but not dips below this threshold until late next year or beyond. This subtle uptick in mortgage rates and the concurrent drop in refinance rates reflect a cautious market response to economic signals, federal monetary policy, and inflation data.

Today's Mortgage Rates – August 18, 2025: Fixed Rates Climb, 30-Year FRM Rises by 2 Basis Points

Key Takeaways

  • 30-year fixed mortgage rate rose slightly to 6.69%, up 2 basis points since last week.
  • 15-year fixed mortgage rate increased to 5.81%.
  • 5-year ARM mortgage rate moved up to 7.19%.
  • Refinance 30-year fixed rates decreased marginally to 6.87%, down 4 basis points.
  • Experts predict rates will remain above 6% through 2025, possibly dropping below 6% only by Q3 2026.
  • The Federal Reserve’s stance with possible rate cuts in the fall 2025 could influence mortgage rates downward.
  • Economic uncertainty and inflation's stickiness keep rates elevated.

Current Mortgage Rates Overview for August 18, 2025

Understanding the current mortgage rates helps buyers and refinancers grasp what to expect and where the market stands. The rates vary depending on loan terms and types — conventional conforming loans, government-backed loans, and adjustable-rate mortgages (ARMs).

Loan Type Rate (%) Change From Last Week APR (%) Change From Last Week
30-Year Fixed (Conforming) 6.69 +0.02% 7.24 +0.11%
20-Year Fixed (Conforming) 6.37 -0.30% 6.88 -0.11%
15-Year Fixed (Conforming) 5.81 +0.05% 6.18 +0.11%
10-Year Fixed (Conforming) 5.48 0.00% 5.84 0.00%
7-Year ARM (Conforming) 7.30 -0.24% 8.06 +0.05%
5-Year ARM (Conforming) 7.19 -0.05% 7.96 +0.15%
30-Year Fixed FHA 6.26 +0.21% 7.28 +0.22%
30-Year Fixed VA 6.25 +0.11% 6.46 +0.13%
15-Year Fixed FHA 5.58 +0.02% 6.54 +0.02%
15-Year Fixed VA 5.88 +0.12% 6.23 +0.15%

Source: Zillow, August 18, 2025

Refinance Rates Today – August 18, 2025

Refinancing may offer some small relief, as refinance rates have edged slightly downward, contrary to purchase mortgage rate trends. Here’s the latest refinance average rates:

Refinance Loan Type Rate (%) Change From Last Week APR (%) Change From Last Week
30-Year Fixed Refinance 6.87 -0.04% — —
15-Year Fixed Refinance 5.87 +0.13% — —
5-Year ARM Refinance 7.71 0.00% — —

Source: Zillow, August 18, 2025

What’s Driving Mortgage Rates Right Now?

Mortgage rates have hovered between approximately 6.6% and 6.8% throughout most of 2025, registering minor fluctuations in response to pivotal economic reports and central bank policies.

  • Economic Signals: Weak job growth data released early August indicated slowing employment gains, which tends to temper rate increases as economic momentum eases.
  • Federal Reserve Policy: Markets are pricing in a likely 25 basis point cut to the federal funds rate in September 2025, with some economists anticipating up to two cuts by year-end. This prospective easing is due to slowing growth and difficulties in inflation reduction, despite inflation still being somewhat “sticky.”
  • Inflation Trends: Core inflation remains above the Fed’s comfort zone (~2.7% PCE), but it’s below harsher projections, creating a delicate balancing act that influences bond yields and mortgage interest rates.

The interplay of these economic forces shapes mortgage rate trends: faltering growth usually pushes rates down, but persistent inflation can keep rates elevated.

Expert Forecasts on Mortgage Rates Under Current Circumstances

Multiple authoritative groups have issued forecasts that reflect cautious optimism for homebuyers and refinancers:

  • National Association of REALTORS®: Predicts mortgage rates will average 6.4% in the second half of 2025 and dip to 6.1% by 2026.
  • Fannie Mae: Projects rates to stay above 6% until Q3 2026, nearing 6.4% by the end of 2025 (Fannie Mae July Housing Forecast).
  • Realtor.com: Indicates a slow easing with average purchase mortgage rates closing at 6.4% by year-end.
  • Mortgage Bankers Association: Expects 30-year fixed rates to hold around 6.7% at year-end 2025 before dropping below 6.5% in 2026.

This consensus supports the view that while mortgage affordability remains a challenge, prospective buyers shouldn’t expect dramatic rate drops this year.

How The Federal Reserve's Monetary Policy Affects Mortgage Rates

Understanding the Fed’s recent monetary policies and their impact on mortgage rates is critical for grasping the present and future environment:

  • 2021-2023: The aggressive rate hikes by the Fed to fight inflation pushed mortgage rates to two-decade highs.
  • Late 2024: The Fed pivoted to cutting rates for the first time in years, reducing the federal funds rate by 100 basis points in total.
  • 2025 Stalemate: The Fed paused hikes and rate cuts from January through July 2025, citing concerns over persistent inflation and uneven economic data.
  • Upcoming Meetings: Market odds for a September 2025 rate cut hover just below 50%, sensitive to incoming labor and inflation reports.

The Fed influences mortgage rates indirectly by affecting bonds and the cost of money. Their future moves, especially potential cuts, could bring relief to mortgage rates if inflation moderates.

Example: Calculating Monthly Payment on a 30-Year Fixed Mortgage at Today's Rate

To give perspective on how today's mortgage rates translate into payments, consider a $300,000 loan at 6.69% fixed for 30 years:

Loan Amount Interest Rate Term Monthly Principal & Interest
$300,000 6.69% APR 30 years $1,927

Calculation:

Using the standard mortgage formula, the monthly payment (principal + interest) is approximately $1,927.

Compare that to last week’s rate of 6.67%, which would have yielded a payment of about $1,918. This small increase adds roughly $9 more per month.


Related Topics:

Mortgage Rates Trends as of August 17, 2025

Mortgage Rates Predictions Next 90 Days: August to October 2025

Mortgage Rates Predictions for the Next 60 Days

Mortgage Rates Predictions for Next 90 Days: July-Sept 2025

Why Mortgage Rates Remain Above 6% Despite Expectations

Throughout 2024 and 2025, many anticipated mortgage rate declines due to Fed rate cuts. However, rates have stubbornly stayed above 6% because:

  • Inflation pressures remain elevated, causing bond yields—and mortgage rates—to be resilient.
  • Global economic uncertainties create volatility, leading to cautious movements among investors.
  • Lag effects: Mortgage rates can be slow to respond to Fed moves and often factor in long-term inflation expectations more than immediate policy changes.

Thus, it pays to understand that mortgage rates reflect a complex blend of factors, not just Fed announcements.

Detailed Breakdown of ARM vs Fixed Rates

For borrowers weighing options between fixed and adjustable mortgage rates, here’s the current snapshot:

Loan Type Current Rate (%) Weekly Change Notes
30-Year Fixed 6.69 +0.02% Most stable, predictable
15-Year Fixed 5.81 +0.05% Lower rate, higher monthly payments
5-Year ARM 7.19 -0.05% Starts higher, adjustable later
7-Year ARM 7.30 -0.24% Slight drop, riskier after fixed period

ARMs tend to have higher initial rates but can adjust down/up after initial period. They might appeal to buyers planning to sell or refinance before the adjustment.

The Role of Government Loan Programs

Government-backed loans such as FHA and VA typically offer slightly lower rates, which can be attractive:

  • FHA 30-year fixed increased to 6.26%, up several basis points.
  • VA 30-year fixed at 6.25%, a modest rise.
  • These loans support buyers with lower credit scores or military service but come with specific qualification standards.

Personal Perspective: What This Means for Buyers and Refinancers

From my experience tracking mortgage trends for years, the current rate environment underscores the importance of realistic expectations. While the dream of rates dropping below 5% might be enticing, the economic realities and policies in place suggest a more tempered scenario.

If you're a buyer, locking in a rate today might protect you from future hikes, especially if the expected rate cuts are delayed or minimal.

For those refinancing, the slight dip in refinance rates is a sliver of hope—but rates remain high compared to recent history, making it essential to weigh closing costs against monthly savings carefully.

Mortgage decisions in 2025 require balancing economic forecasts, personal financial situations, and long-term housing plans carefully.

Capitalize Amid Rising Mortgage Rates

With mortgage rates expected to remain high in 2025, it’s more important than ever to focus on strategic real estate investments that offer stability and passive income.

Norada delivers turnkey rental properties in resilient markets—helping you build steady cash flow and protect your wealth from borrowing cost volatility.

HOT NEW LISTINGS JUST ADDED!

Speak with a seasoned Norada investment counselor today (No Obligation):

(800) 611‑3060

Get Started Now

Also Read:

  • Will Mortgage Rates Go Down in 2025: Morgan Stanley's Forecast
  • Mortgage Rate Predictions 2025 from 4 Leading Housing Experts
  • Mortgage Rate Predictions for the Next 3 Years: 2026, 2027, 2028
  • 30-Year Fixed Mortgage Rate Forecast for the Next 5 Years
  • 15-Year Fixed Mortgage Rate Predictions for Next 5 Years: 2025-2029
  • Will Mortgage Rates Ever Be 3% Again in the Future?
  • Mortgage Rates Predictions for Next 2 Years
  • Mortgage Rate Predictions for Next 5 Years
  • Mortgage Rate Predictions: Why 2% and 3% Rates are Out of Reach
  • How Lower Mortgage Rates Can Save You Thousands?
  • How to Get a Low Mortgage Interest Rate?
  • Will Mortgage Rates Ever Be 4% Again?

Filed Under: Financing, Mortgage Tagged With: Interest Rate, mortgage, Mortgage Rate Trends, mortgage rates, Mortgage Rates Today

Denver Housing Market Cools: Leads the Nation in Price Reductions

August 18, 2025 by Marco Santarelli

Denver Housing Market Cools: Leads the Nation in Price Reductions

Are you trying to buy a home in Denver? Well, here's some good news! The Denver housing market cools, and it's actually leading the nation in price reductions. That’s right, Denver tops the list with the highest percentage of homes having their price slashed in June. This shift signals a significant change, giving buyers more leverage and a chance to breathe after years of intense competition. Let’s dive into what's behind this trend and what it means for you.

Denver Housing Market Cools: Leads the Nation in Price Reductions

What's Happening in Denver?

For the past few years, Denver has been a seller's paradise. Homes were selling above asking price, bidding wars were common, and inventory was incredibly tight. But now, things are changing. According to recent data, Denver leads the nation with a whopping 38.3% of active listings having undergone a price reduction in June.

Why is this happening?

  • Affordability Ceiling: Let's be real, housing prices in Denver skyrocketed during the pandemic. While Denver has always been an expensive real estate market, salaries have had a hard time keeping up, pushing many potential buyers to their limit. As mortgage rates rise, it makes it even harder for people to afford homes, leading to less demand. I think many people are now realizing they are priced out of the market.
  • Slowing Population Growth: Denver saw a huge influx of people over the past decade, especially during the pandemic as remote work became more common. However, that rapid growth is slowing down. With fewer people moving in, the demand for housing decreases.
  • Increased Inventory: Compared to the pre-pandemic days, Denver has more homes available on the market. More homes on the market mean more choices for buyers, and sellers need to be more competitive to attract attention. I've seen it firsthand; homes are sitting on the market longer than they used to!

Other Cities Seeing Price Cuts

Denver isn't alone. According to Zillow's data, other cities that experienced massive growth during the pandemic are also seeing a rise in price reductions. Places like:

  • Raleigh (36.4%)
  • Dallas (35.5%)
  • Nashville (35.5%)
  • Phoenix (35.5%)

These “boomtowns” are now rebalancing as the initial surge of new residents slows down and affordability becomes a bigger issue.

A National Trend?

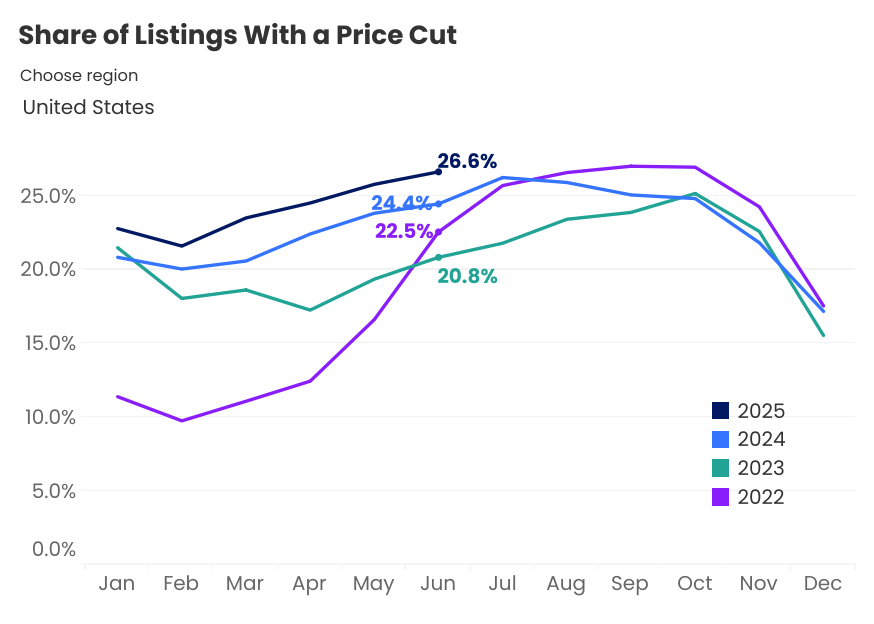
Absolutely! Nationally, over one in four listings saw a price cut in June, hitting 26.6%. Looking at the graph, we can see that the trend of price cuts is on the rise. That’s the highest ever for June in Zillow data.

Price Cuts in Housing Market
Source: Zillow

Here's a little summary of data:

National Trend In price Cuts

Month Percentage of listings
June, latest reporting 26.6%

Cities Seeing Biggest Jumps in Price Cuts (May to June)

Some cities are seeing a rapid increase in the number of price cuts. Here's a list:

  • Kansas City (+5 percentage points)
  • Buffalo (+3.9 pts)
  • Indianapolis (+3.8 pts)
  • Columbus (+3.3 pts)
  • Minneapolis (+3.2 pts)

This rapid increase often suggests a rapidly cooling market.

Who Still Has the Upper Hand?

Of course, not every market is experiencing the same trend. According to the data I see, there are still some areas where sellers are in control due to tight inventory:

  • Milwaukee (13.9% of listings with a price cut)
  • New York (15.6%)
  • Hartford (16.0%)
  • Buffalo (18.3%)
  • San Jose (22.1%)

What This Means for Buyers

So, what does all this mean if you're looking to buy a home? Here’s my take:

  • More Negotiating Power: Gone are the days of automatically offering over asking price. You might actually be able to negotiate with sellers and get a better deal.
  • Fewer Bidding Wars: With fewer buyers competing for each home, you're less likely to get caught up in crazy bidding wars. Thank goodness!
  • More Time to Decide: You won't feel as rushed to make a decision. You can take your time to inspect homes and consider your options.
  • Potential for Seller Concessions: In some markets, you might even be able to ask sellers to cover some of your closing costs or offer other incentives. This is definitely something to discuss with your realtor.

Tips for Buyers in a Cooling Market

Here's my advice as a real estate professional:

  1. Get Pre-Approved: Knowing your budget and getting pre-approved for a mortgage puts you in a stronger position when you do find the right home.
  2. Work with a Good Real Estate Agent: A local agent can offer valuable insights into the market and help you negotiate effectively. I can help you find one.
  3. Do Your Research: Don't just jump at the first home you see. Take your time to research different neighborhoods and find a place that fits your needs and budget.
  4. Don't Be Afraid to Make an Offer: With prices coming down, now is the time to make a reasonable offer on a home you love.

What This Means for Sellers

For sellers, however, the times are changing a little bit:

  • Pricing is Key: You can't just throw a high price on your home and expect it to sell quickly. You need to price it competitively based on comparable sales in your area.
  • Presentation Matters: Make sure your home is in top condition before you list it. Clean, declutter, and make any necessary repairs.
  • Marketing is Important: Work with your agent to create a strong marketing plan that will attract potential buyers to your home. I believe that having a good plan is critical.
  • Be Open to Negotiation: Be prepared to negotiate with buyers. You might not get the full asking price, but you can still get a fair price for your home.

My Prediction

I think we'll see more price cuts in the months ahead. While mortgage rates and home prices aren't expected to drastically improve, the market will continue to rebalance, giving buyers more opportunities.

The Bottom Line: The Denver housing market cools, offering a much-needed break for buyers. While it's not a fire sale just yet, the shift in the market is undeniable. If you're a buyer, now is the time to get prepared and start your search. If you're a seller, adjust your expectations and be ready to compete. The market is changing, and those who adapt will be the most successful.

Invest in Real Estate in the Top U.S. Markets in 2025

Discover high-quality, ready-to-rent properties designed to deliver consistent returns.

Contact us today to expand your real estate portfolio with confidence.

Contact our investment counselors (No Obligation):

(800) 611-3060

Get Started Now 

Recommended Read:

  • Denver Housing Market: Trends and Forecast 2025-2026
  • Denver Housing Market Trends: Sellers Still Have the Upper Hand
  • Denver Housing Market Heats Up Again: Can You Afford?
  • Where to Buy Denver Investment Properties in 2025?
  • Colorado housing market forecast & trends
  • Is Buying a House in Denver a Wise Investment
  • Buying a House in Denver in 2025: Comprehensive Guide

Filed Under: Growth Markets, Housing Market Tagged With: Denver Housing Market, Denver Real Estate Market

Las Vegas Housing Market Predictions Next 2 Years: Crash or Correction?

August 18, 2025 by Marco Santarelli

Las Vegas Housing Market Predictions Next 2 Years: Crash or Correction?

Thinking about buying or selling a house in Las Vegas? You're probably wondering what the future holds for the Las Vegas housing market in the next 2 years or so. The short answer? According to recent data, some modest declines are expected. Zillow's forecast projects a decrease of 1.2% in home values over the next year (June 2025 to June 2026). But before you panic or celebrate, let's dive deep into the numbers, the trends, and what it all really means for you. Forget the get-rich-quick schemes, we're talking real talk about the Las Vegas real estate scene.

Las Vegas Housing Market Predictions for the Next 2 Years: Will Prices Drop?

🏠
Las Vegas Housing: Quick Insights (Mid-2025)
  • 📈
    Current Home Value: Approximately $438,432, a slight *increase* of 0.9% year-over-year.
  • 📉
    Near-Term Forecast (Next 3 Months): Expect a modest *decline* of -1.2% by September 2025.
  • 📅
    1-Year Outlook (Mid-2026): Projecting a further *decrease* of -1.2% from June 2025 levels.
  • 💡
    Key Factors to Watch: Monitor unemployment, job growth, and especially *mortgage rate* fluctuations. Inventory is also up.

Updated: July 31, 2025. Forecasts based on current data & trends.

The Current Temperature of the Las Vegas Housing Market

Okay, so let's look at where we are right now (as of late July 2025). Here's a snapshot of the Las Vegas housing market:

  • Average Home Value: $438,432
  • Year-over-Year Change: Up 0.9%
  • Homes for Sale: 12,936
  • New Listings (July 2025): 3,290
  • Median Sale to List Price Ratio (June 2025): 0.991
  • Median Sale Price (June 2025): $431,917
  • Median List Price (July 2025): $467,933
  • Sales Over List Price (June 2025): 20.1%
  • Sales Under List Price (June 2025): 55.8%
  • Median Days to Pending (July 2025): 31 days

What does this all mean? Well, prices are still slightly up compared to last year. Basically, it's a more balanced market than we've seen in recent years.

One thing that stands out to me is the median days to pending. Homes are going under contract in about a month. That's not super speedy, suggesting that buyers are being more cautious, and there is less competition.

Forecasts for the Next 2 Years: What the Experts Predict

Okay, let's get to the heart of the matter: what's going to happen with home prices in Las Vegas over the next two years? The data suggests some softening in the market.

Here's a look at Zillow's forecasts:

Timeframe Predicted Change
July 31, 2025 -0.4%
September 30, 2025 -1.2%
June 30, 2026 -1.2%

As you can see, Zillow is forecasting a slight decline in home values in the short term, extending into 2026. It's a modest drop, but it's a drop nonetheless.

How Does Las Vegas Compare to Other Nevada Markets?

It's important to put these forecasts into context. How is Las Vegas expected to perform compared to other cities in Nevada? Here's a comparison:

City July 31, 2025 June 30, 2026
Reno -0.4% -2.1%
Fernley -0.3% -2.3%
Carson City -0.1% -1.4%
Elko -0.2% -2.4%
Pahrump -0.3% -1.6%
Gardnerville Ranchos -0.1% -2.4%
Fallon -0.2% -0.9%
Winnemucca 0.1% 0.2%
Las Vegas -0.4% -1.2%

Compared to other regions in Nevada, Las Vegas is neither the worst nor the best. Several areas are expected to see bigger declines, while Winnemucca is supposed to increase slightly.

National Trends and Expert Opinions

It's not just about what's happening in Las Vegas; we need to look at the bigger picture. What's going on nationally?

According to Lawrence Yun, the Chief Economist for the National Association of Realtors (NAR), things are looking up overall. He expects:

  • Existing Home Sales: Up 6% in 2025 and 11% in 2026
  • New Home Sales: Up 10% in 2025 and 5% in 2026
  • Median Home Prices: Up 3% in 2025 and 4% in 2026
  • Mortgage Rates: Averaging 6.4% in the second half of 2025 and 6.1% in 2026

So, nationally, the outlook is more optimistic than what Zillow is predicting for Las Vegas. Yun believes that lower mortgage rates will be the “magic bullet” to boost the real estate market.

Why the Discrepancy?

You might be wondering why there's a difference between the national forecast and the Las Vegas forecast. Here's my take:

  • Local Market Conditions: Las Vegas is unique. Its economy relies heavily on tourism, and population growth has been a major driver of housing demand for years. If either of those factors changes, it can have a big impact.
  • Affordability: Home prices in Las Vegas have risen significantly in recent years, making it harder for people to afford to buy. This could be contributing to the expected slowdown.

Will Home Prices Crash in Las Vegas?

That's the question on everyone's mind, right? Will we see a repeat of 2008?

Based on the data and expert analysis, I don't think so. A crash is unlikely. While prices might soften a bit, the factors that led to the previous crash (like predatory lending and overbuilding) aren't present today.

A Possible Forecast for 2026

While Zillow hasn't released its detailed projections for 2026, we can use the available info to make an educated guess. Given the expected trends, I'd say it's reasonable to expect the Las Vegas housing market to be:

  • Relatively Stable: Slight price appreciations in the second half of the year.
  • Slightly Below 2025 Prices: A small dip from 2025 values.
  • Driven by Economic Factors: The health of the Las Vegas economy, unemployment rates, and interest rates will be crucial.

How Will Economic Trends Impact the Housing Market?

Speaking of the economy, let's dig deeper into how economic factors could affect the Las Vegas housing market.

  • Unemployment: The unemployment rate in the Las Vegas area was 5.8% in June 2025 (not seasonally adjusted). That's higher than the national average. However, Nevada's unemployment rate (seasonally adjusted) was 5.4% in July 2025. A consistently high unemployment rate could hurt the housing market by reducing the number of people who can afford to buy a home. It can also lead to more foreclosures.
  • Job Growth: Las Vegas MSA saw an increase of 4,200 jobs (0.4%) from June to July 2025. However, the private sector lost 1,200 jobs in July 2025, continuing a trend of job losses. If job growth slows significantly, it could put downward pressure on home prices.
  • Population Growth: The Las Vegas Valley has seen tremendous population growth over the past few decades. However, the rate of growth has started to slow. Slower population growth could mean less demand for housing.

Population Statistics (Metro Area):

  • 2023 Population: 2,293,764
  • Foreign-Born Residents (2023): Approx. 21.7%

Who Should Buy In The Next Two Years?

If you're prepared to make a purchase, it might be an excellent time for a first-time buyer to get into the market. The rates may be high, but not as high as they could peak. Inventory is also up, helping the people buying a home and the people selling, too.

My Personal Thoughts

Look, predicting the future is always tricky. But from what I can see, the Las Vegas housing market is unlikely to give us anything too exciting in the next couple of years. Don't expect a boom, but don't expect a crash either. If you're a buyer, have patience and keep your eyes open. If you're a seller, price your home competitively and be prepared to negotiate.

Ultimately, buying or selling a home is a personal decision that depends on your individual circumstances. Do your homework, talk to a real estate professional and make the best choice for you and your family.

Position Yourself for Stability Amid Market Uncertainty

With growing speculation about a potential cooling of the housing market, the smartest investors are diversifying into markets with proven resilience.

Norada provides turnkey rental properties in high-demand, economically stable areas—helping you secure passive income and safeguard against market downturns.

NEW CASH-FLOWING PROPERTIES JUST LISTED!

Speak with an experienced Norada investment counselor today (No Obligation):

(800) 611-3060

Get Started Now

Recommended Read:

  • Where to Buy Las Vegas Investment Properties in 2025: Top Neighborhoods
  • Las Vegas Real Estate Forecast for the Next 5 Years
  • Las Vegas Housing Market: Prices, Trends, Forecast
  • Las Vegas Housing Market 2024: Is It a Bubble? Is It Falling?
  • Homebuyers Are Moving to Sacramento, Las Vegas, and Orlando
  • Housing Market Predictions for the Next 4 Years
  • Housing Market Predictions for Next 5 Years
  • Real Estate Forecast Next 5 Years: Top 5 Predictions for Future

Filed Under: Housing Market, Real Estate Market Tagged With: Housing Market, housing market predictions, Las Vegas, Nevada

Single-Family Rentals Predicted to Appreciate 2.5% Annually in 2025

August 17, 2025 by Marco Santarelli

Single-Family Rentals Predicted to Appreciate 2.5% Annually in 2025

If you're thinking about investing in or are currently owning single-family rental homes, you'll want to pay attention to the latest projections from Zillow. My take on it is that single-family rental homes are now expected to appreciate 2.5% annually, according to Zillow's revised forecast. This is a key piece of information for anyone navigating the rental property market, and it tells us that while the rapid rent hikes we've seen might be cooling, rental income is still projected to grow steadily.

Single-Family Rental Homes: A 2.5% Annual Appreciation Forecast

For a while now, it seems like rents have been on a bit of a rollercoaster. We’ve experienced some pretty significant jumps, making it a challenging time for renters and a potentially lucrative one for landlords. However, the market is always shifting, and understanding these shifts is crucial for making smart investment decisions. Zillow's latest outlook suggests a normalization of sorts, with a more predictable, though still positive, rate of appreciation for single-family rentals.

What Does This 2.5% Appreciation Mean for You?

When Zillow talks about appreciation, they're essentially forecasting how much the value of these rental homes is likely to increase over time, driven largely by rental income growth. A healthy rent growth rate translates into higher returns for property owners. This 2.5% annual increase, while not the explosive growth some might have hoped for, is a solid, sustainable rate. It means that if you own a single-family rental home valued at, say, $300,000, you could expect its value to increase by about $7,500 in a year, before accounting for any appreciation in the broader housing market.

It's important to remember that this figure is a forecast, an educated guess based on models and current economic trends. What I find particularly interesting is how Zillow arrives at these numbers. They don't just look at what new tenants are being asked to pay. They factor in how many people move, how many renew their leases, and how landlords adjust rents for those long-term tenants. This is a much more nuanced view than just looking at the “on-market” rent changes.

Deconstructing the CPI and Rent Data

To truly understand the 2.5% figure, it helps to peel back the layers a bit and look at the underlying data, especially concerning the Consumer Price Index (CPI). You might see headlines about inflation, and housing costs are a big part of that. The CPI has two main measures that are relevant here: Owner's Equivalent Rent (OER) and Rent of Primary Residence.

  • Owner’s Equivalent Rent (OER): This is a bit of a theoretical measure. It tries to estimate what homeowners would pay to rent their own homes. Zillow predicted a 0.31% increase in OER for July, and the actual release showed a slight dip to 0.28%. While the July number was a tad lower than expected, the overall trend for OER is forecasted to decelerate. Zillow expects OER to finish the year up 3.4% year-over-year, but then take a significant dive to a 1.9% increase in 2026.
  • Rent of Primary Residence: This is a more direct measure of what people are actually paying in rent. Zillow had anticipated a 0.18% rise for July, but the actual figure came in a little higher at 0.26%. What's crucial here, and what I find more telling, is that since April, the pace of rent growth has actually slowed down by over a full percentage point. Zillow's forecast for this measure to end the year up 2.7% year-over-year, with a sharp fall to just 0.6% in 2026, really points to a softening in the rental market.

While the CPI measures are slightly different from Zillow’s on-market rent growth forecasts, they are linked. The CPI figures often lag a bit because they include rent changes for existing tenants who might not face market rates as frequently as new renters. This is why the 2.5% appreciation forecast for single-family rentals, which is based on Zillow’s Observed Rent Index (ZORI), is so important. It reflects the current rental market dynamics more directly.

Why the Deceleration in Rent Growth?

Several factors contribute to this expected slowdown in rent appreciation. One of the biggest drivers is the significant deceleration in market rents over the past few months. Think about it: when demand for rentals cools down, or when the supply of available rental properties increases, landlords can't just keep raising rents indefinitely.

We've also seen softening growth in market rents, and this will likely continue to put downward pressure on housing prices within the CPI over time. It’s a bit of a balancing act. For a while, housing costs were a major contributor to inflation across the board. Now, it seems like their impact is moderating.

Another element to consider is the broader economic picture. Factors like interest rate changes, or even shifts in consumer spending due to things like tariffs on goods, can influence the overall demand for housing. When people have less disposable income or face higher borrowing costs, they tend to be more price-sensitive when it comes to rent.

My Perspective: A Reality Check and a Strategic Opportunity

From my experience in real estate, these kinds of adjustments are normal. The market doesn't go up in a straight line forever. What Zillow's forecast suggests is a return to a more stable, predictable appreciation rate for single-family rental homes. This is actually a good thing for long-term investors.

  • Stability is Key: While 8-10% annual rent growth might grab headlines, it's often not sustainable. A 2.5% appreciation rate, combined with a solid rental yield, can provide a very healthy passive income stream with less risk.
  • Cash Flow Focus: With moderating rent growth, the focus for investors might shift even more towards ensuring strong cash flow from properties. This means looking at the numbers carefully: mortgage payments, property taxes, insurance, maintenance, and vacancy rates.
  • The Single-Family Advantage: I still see a lot of value in single-family rentals compared to, say, larger apartment buildings. They often attract longer-term tenants, have lower turnover, and can be less susceptible to the massive rent swings sometimes seen in multi-unit properties. The 2.5% forecast for single-family homes versus a projected 1.0% for apartments further highlights this potential advantage.
  • Long-Term Outlook: The forecast of significantly lower rent increases in 2026 (0.6% for Rent of Primary Residence) is a key takeout. This doesn't mean rents will fall, but the rapid acceleration is over, ushering in a period of much slower growth. This is important for cash flow projections and for understanding future profitability.

The Mechanics Behind the Numbers: Zillow's Methodology

It's always good to know how these predictions are made. Zillow's model uses its own Observed Rent Index (ZORI) and looks at the relationship between “on market” rents and the CPI shelter components I mentioned. My understanding of their approach includes:

  • Expected On-Market Rent Growth: This is primarily driven by Zillow's own rental forecast data (ZORF).
  • Lease Renewal Assumptions: They calculate how often landlords increase rents when leases are renewed.
  • Renter Mobility: This factor considers how many tenants move each year, which determines how many are exposed to new, potentially higher, market rents.

This multi-faceted approach gives a more realistic picture than just looking at one data point. It accounts for the fact that not everyone's rent goes up at the same time or by the same amount.

Implications for Investors and Renters

For those looking to acquire single-family rental homes, this forecast signals a market that is stabilizing. It's a time to focus on fundamentals: location, property condition, and conservative financial projections. While the days of astronomical yearly rent increases may be behind us for now, the steadier appreciation of 2.5% annual growth provides a reliable foundation for building wealth through real estate.

For renters, this projected slowdown in rent growth is welcome news. It means the pressure on household budgets might ease, allowing for greater financial stability. However, it's still crucial to budget wisely, as rents are not expected to decrease, merely to grow at a more moderate pace.

Looking Ahead: What to Monitor

The real estate market is dynamic. While Zillow's forecast provides a valuable insight, it's essential to keep an eye on unfolding economic events. We need to watch:

  • Interest Rate Policies: Changes in interest rates can significantly impact the cost of mortgages for both buyers and investors, as well as potentially influence tenant spending power.
  • Housing Supply: An increase in the supply of available rental homes can naturally lead to more modest rent growth.
  • Economic Stability: Overall economic health, job growth, and consumer confidence all play a role in housing demand.
  • Inflation Trends: While housing inflation is expected to moderate, broader inflation trends can still affect the cost of property ownership (taxes, insurance, maintenance) and the overall purchasing power of renters.

The projected deceleration in CPI housing inflation measures through late 2025 and 2026, driven by the softening in market rents, is a significant development. The 2.5% annual appreciation forecast for single-family rental homes from Zillow is a key data point in this evolving picture, suggesting a more predictable and potentially sustainable period ahead for real estate investors.

Real Estate Investment in the Top U.S. Markets

Discover high-quality, ready-to-rent properties designed to deliver consistent returns.

Contact us today to expand your real estate portfolio with confidence.

Contact our investment counselors (No Obligation):

(800) 611-3060

Get Started Now 

Also Read:

  • Best Places to Invest in Single-Family Rental Properties in 2025
  • Why Real Estate Can Thrive During Tariffs Led Economic Uncertainty
  • Rise of AI-Powered Hyperlocal Real Estate Marketing in 2025
  • Real Estate Forecast Next 5 Years: Top 5 Predictions for Future
  • 5 Hottest Real Estate Markets for Buyers & Investors in 2025
  • Will Real Estate Rebound in 2025: Top Predictions by Experts
  • Recession in Real Estate: Smart Ways to Profit in a Down Market
  • Will There Be a Real Estate Recession in 2025: A Forecast
  • Will the Housing Market Crash Due to Looming Recession in 2025?
  • 4 States Facing the Major Housing Market Crash or Correction
  • New Tariffs Could Trigger Housing Market Slowdown in 2025
  • Real Estate Forecast Next 10 Years: Will Prices Skyrocket?
Filed Under: Housing Market, Real Estate Market Tagged With: Rental Properties, Single-Family Homes, Single-Family Rentals

Today’s Mortgage Rates – August 17, 2025: Rates Rise Marginally Across the Spectrum

August 17, 2025 by Marco Santarelli

Today's Mortgage Rates - August 17, 2025: Rates Rise Marginally Across the Spectrum

As of August 17, 2025, mortgage rates have seen a slight increase for certain loan types, with the 30-year fixed mortgage rate climbing from 6.68% to 6.73%. Meanwhile, refinance rates have generally decreased slightly, with the 30-year fixed refinance rate falling from 6.95% to 6.91%. This mixed movement reflects ongoing economic uncertainty and anticipation around Federal Reserve policy moves later this year.

Today's Mortgage Rates – August 17, 2025: Rates Rise Marginally Across the Spectrum

Key Takeaways

  • 30-year fixed mortgage rates increased to 6.73%, up 5 basis points from last week.
  • 15-year fixed mortgage rates slightly decreased to 5.77%.
  • 5-year ARM mortgage rates rose significantly to 7.38%.
  • 30-year fixed refinance rates modestly dropped to 6.91%, down 4 basis points from last week.
  • Federal Reserve signals potential rate cuts in September and December 2025, which could lower mortgage rates later this year.
  • Experts predict mortgage rates to stay above 6% through 2025 and ease toward 6.1-6.4% in 2026.
  • Job growth weakness and inflation data are influencing mortgage rate trends.

Current Mortgage Rates Overview – August 17, 2025

Mortgage rates today show a nuanced picture:

Loan Type Rate (8/17/2025) 1 Week Change APR 1 Week APR Change
30-Year Fixed 6.73% +0.05% 7.11% -0.02%
20-Year Fixed 6.37% -0.10% 6.88% 0.00%
15-Year Fixed 5.76% +0.01% 5.96% -0.09%
10-Year Fixed 5.48% 0.00% 5.84% 0.00%
7-Year ARM 7.30% +0.21% 8.06% +0.47%
5-Year ARM 7.38% +0.15% 7.78% 0.00%

Note: ARM = Adjustable Rate Mortgage

Government-backed loans have seen small decreases this week:

Loan Type Rate (8/17/2025) 1 Week Change APR 1 Week APR Change
30-Year Fixed FHA 6.27% -0.10% 7.28% -0.11%
30-Year Fixed VA 5.95% -0.21% 6.01% -0.33%
15-Year Fixed FHA 5.40% -0.11% 6.36% -0.11%
15-Year Fixed VA 5.55% -0.21% 5.66% -0.43%

(Source: Zillow)

Refinance Rates Today – August 17, 2025

Refinancing offers a slightly more favorable environment with small improvements:

Refinance Loan Type Rate (8/17/2025) 1 Week Change
30-Year Fixed 6.91% -0.04%
15-Year Fixed 5.76% 0.00%
5-Year ARM 7.60% -0.12%

The refinance rates' slight decline suggests homeowners with higher existing rates might find better opportunities if the Fed moves to cut interest rates later this year.

What’s Behind These Movements in Mortgage Rates?

Mortgage rates for August 2025 are largely influenced by a few key economic factors:

  • Federal Reserve Monetary Policy: The Fed has held the federal funds rate steady through five meetings in 2025 but is widely expected to cut rates later this year, possibly in September or December. This anticipation is keeping rates somewhat steady but with volatility.
  • Economic Data: Weak job growth in recent months and inflation in July that remains “sticky” but below expectations have affected traders' and lenders' outlook.
  • Inflation & GDP: Inflation persists around 2.7% core PCE, and GDP growth slowed to about 1.2% annualized. This slow growth contributes to uncertainty in mortgage markets.
  • Market Sentiment: Bond market activity, especially in the 10-year Treasury yield (around 4.34%), plays a direct role in mortgage rate fluctuations.

Mortgage rates have hovered mostly between 6.6% and 6.8% for much of 2025, showing a narrow but persistent high range. Most experts agree that while some declines may come by year-end or in 2026, rates are expected to stay above 6% for the foreseeable future.

Forecast: What Experts Are Saying on Mortgage Rates

Mortgage rate outlooks from several reputable sources provide varied but cautious optimism:

  • National Association of REALTORS®: Predict an average mortgage rate to hover around 6.4% in the latter half of 2025, dipping slightly to about 6.1% in 2026. They stress mortgage rates strongly affect buyer affordability and demand.
  • Fannie Mae: Their latest outlook sees mortgage rates ending 2025 near 6.5%, easing to 6.1% in 2026, with economic growth expected to pick up slightly next year.
  • Mortgage Bankers Association: Projects 30-year rates to stay near 6.8% through September 2025, then to soften gradually toward mid-6% range by 2026.
  • Realtor.com: Foresees mortgage rates easing slowly, matching the prior year’s average overall but dipping modestly by year-end.

These forecasts reflect the delicate balance of economic forces, Fed policy decisions, and inflation pressures shaping mortgage markets.

Example Calculation: Impact of Rate Changes on Monthly Payments

To understand the impact of the current rate fluctuation, consider a $300,000 loan amount with a 30-year fixed mortgage.

Mortgage Rate Monthly Principal & Interest Payment (Approx.)
6.68% (Last Week) $1,940
6.73% (Today) $1,947

A 5 basis points increase raises the monthly payment by about $7, which may seem small but adds up over 30 years to an extra $2,520.

In contrast, a refinance rate drop on a similar loan affects total payments and savings:

Refinance Rate Monthly Payment Change From Prior Week
6.95% $1,996 Baseline
6.91% $1,990 -$6

While changes seem minor week-to-week, over large loan balances, even small rate shifts can have significant financial implications long term.

The Federal Reserve’s Role in 2024-2025 Mortgage Rate Trends

The Federal Reserve’s monetary policy decisions are the biggest influence on mortgage rate trends. Here’s what happened recently and what’s ahead:

  • During the pandemic, mortgage rates were extremely low due to Fed bond purchases supporting the economy.
  • The Fed then raised rates aggressively from 2022 through mid-2023 to fight inflation, causing mortgage rates to spike to near 7%.
  • In late 2024, the Fed reversed course, cutting rates three times, bringing federal funds rate down to 4.25%-4.5%.
  • In 2025, the Fed paused rate changes but faces pressure from some leaders to cut rates to support slowing growth.
  • Markets currently place about a 47% chance of a rate cut at the Fed’s September 16-17 meeting.
  • If cuts do occur, mortgage rates may drop closer to 6%, potentially sparking more borrowing and refinancing activity by early 2026.


Related Topics:

Mortgage Rates Trends as of August 16, 2025

Mortgage Rates Predictions Next 90 Days: August to October 2025

Mortgage Rates Predictions for the Next 60 Days

Mortgage Rates Predictions for Next 90 Days: July-Sept 2025

How Do These Rate Changes Affect Buyers and Refinancers?

Buyers facing today’s mortgage rates should recognize that:

  • Rates remain historically high compared to the pandemic era but hover in a relatively narrow, slightly elevated range.
  • Timing purchase decisions on expected rate drops may be risky because the market can move unexpectedly; affordability and personal financial circumstances should guide buying.
  • Government-backed loan rates generally offer slightly more favorable rates for qualified borrowers, which may help counterbalance rising conventional loan rates.

For homeowners considering refinancing:

  • Slight drops in refinance rates may offer an opportunity if your current mortgage rate exceeds 7%.
  • Federal Reserve moves in late 2025 could make refinancing a more cost-effective option soon.
  • ARM refinance rates remain higher, meaning fixed-rate refinancing might be preferable despite rate movements.

Summary Table: August 17, 2025 Mortgage vs. Refinance Rates

Loan Type Mortgage Rate Change from 1 Week Ago Refinance Rate Change from 1 Week Ago
30-Year Fixed 6.73% +0.05% 6.91% -0.04%
15-Year Fixed 5.77% -0.01% 5.76% 0.00%
5-Year ARM 7.38% +0.15% 7.60% -0.12%
FHA 30-Year Fixed 6.27% -0.10% N/A N/A
VA 30-Year Fixed 5.95% -0.21% N/A N/A

Capitalize Amid Rising Mortgage Rates

With mortgage rates expected to remain high in 2025, it’s more important than ever to focus on strategic real estate investments that offer stability and passive income.

Norada delivers turnkey rental properties in resilient markets—helping you build steady cash flow and protect your wealth from borrowing cost volatility.

HOT NEW LISTINGS JUST ADDED!

Speak with a seasoned Norada investment counselor today (No Obligation):

(800) 611‑3060

Get Started Now

Also Read:

  • Will Mortgage Rates Go Down in 2025: Morgan Stanley's Forecast
  • Mortgage Rate Predictions 2025 from 4 Leading Housing Experts
  • Mortgage Rate Predictions for the Next 3 Years: 2026, 2027, 2028
  • 30-Year Fixed Mortgage Rate Forecast for the Next 5 Years
  • 15-Year Fixed Mortgage Rate Predictions for Next 5 Years: 2025-2029
  • Will Mortgage Rates Ever Be 3% Again in the Future?
  • Mortgage Rates Predictions for Next 2 Years
  • Mortgage Rate Predictions for Next 5 Years
  • Mortgage Rate Predictions: Why 2% and 3% Rates are Out of Reach
  • How Lower Mortgage Rates Can Save You Thousands?
  • How to Get a Low Mortgage Interest Rate?
  • Will Mortgage Rates Ever Be 4% Again?

Filed Under: Financing, Mortgage Tagged With: Interest Rate, mortgage, Mortgage Rate Trends, mortgage rates, Mortgage Rates Today

Housing Market Predictions 2025 by Norada Real Estate

August 17, 2025 by Marco Santarelli

Housing Market Predictions 2025 by Norada Real Estate

As we move through August 2025, the housing market is showing a mixed bag of signals, and as Norada Real Estate, we're here to help you make sense of it all. The buzz around housing market predictions for 2025 by Norada Real Estate suggests a market still finding its footing, with some key developments shaping the outlook for the remainder of the year.

Based on the data we’ve seen from January through June 2025, it’s clear that while challenges persist, there are also pockets of opportunity and reasons for cautious optimism. The overall trend points towards a market that, while not exactly explosive, is showing signs of stabilization and even growth in certain areas, especially if mortgage rates continue their anticipated slow decline.

Let's dive into the specifics of what the first half of 2025 has shown us and project what that means for the next several months.

Housing Market Predictions 2025 by Norada Real Estate: What to Expect

A Look Back at the First Half of 2025: Peaks, Valleys, and Developing Trends

The data by the National Association of REALTORS® shows that the first six months of 2025 have provided a fascinating glimpse into the forces at play in our housing market. We've seen fluctuations that reflect broader economic conditions, mortgage rate movements, and evolving buyer and seller sentiment.

  • January 2025: Things started with a bit of a dip. Existing-home sales slipped by 4.9% in January. This was partly due to mortgage rates averaging 6.76% in the months leading up to the closings, a noticeable jump from the low 6% range seen earlier. However, it's important to note that sales were still up 2% compared to the previous year. This suggests that many buyers were indeed adapting to higher borrowing costs. The median home price climbed by 4.8% year-over-year to $396,900. This was interesting because, at the same time, median listing prices were actually coming down. We saw stronger sales in higher price points, while lower-priced listings saw more robust gains, creating a bit of a divergence. The takeaway here was that while the market was cooling slightly, it wasn't collapsing, and buyer adaptability was a key factor.
  • February 2025: We saw a rebound in February, with existing-home sales climbing 4.2% month-over-month to a pace of 4.26 million. However, this month’s sales trailed the year-ago pace by 1.2%. What was driving this? Mortgage rates averaged 6.96% in January, reaching their highest point since May of the previous year, and held steady at 6.84% in February. This clearly demonstrated that mortgage rates were still a dominant factor for shoppers. Despite the higher borrowing costs, the increase in sales showed that buyers and sellers were still managing to connect and find common ground for transactions. The median home price continued its upward trend, growing 3.8% year-over-year, a slight cool-down from the previous month's growth rate. The forecast was cautiously optimistic, with the potential for a reverse in the upward mortgage rate trend, which could boost the busy spring selling season.
  • March 2025: This month brought a more concerning trend. Existing-home sales fell sharply by 5.9% from February, hitting their slowest March pace since 2009. The annual rate was 4.02 million, down 2.4% from the previous year. This was a significant downward shift, especially heading into the crucial spring season. Mortgage rates, while down slightly to 6.65%, had recently climbed. Adding to the uncertainty was a Presidential tariff announcement in early April, which created economic jitters. NAR Chief Economist Lawrence Yun pointed to affordability challenges due to high mortgage rates as the main culprit, noting that housing mobility was at historical lows. Positively, inventory saw a significant jump, up 19.8% from the previous year. This meant more options for buyers, potentially increasing their negotiating power. Despite overall sluggishness, sellers remained confident, with most expecting to get their asking price. The core issue here was shifting from a “not enough sellers” market to worrying about “not enough buyers” due to affordability.
  • April 2025: The slowdown continued. Existing-home sales dropped another 0.5% from March, reaching 4 million, down 2% from the previous year, and marking the slowest April pace since 2009. The total supply of homes for sale jumped to a five-year high of 1.45 million, up 21% from the previous year. This meant a 4.4 months’ supply, the highest since May 2020. The median sales price nationally was $414,000, up 1.8% year-over-year but with regional variations – prices were falling slightly in the South and West but rising in the Northeast and Midwest. Mortgage rates hovered around 6.73%. The tariff announcement’s impact was still being felt, with homebuyer confidence shaken, leading to a spike in contract cancellations. Regionally, the West and South were showing weaker demand compared to the North and Midwest. The consensus was that mortgage rates would likely remain a hurdle for sales in the near term.
  • May 2025: Sales remained sluggish, inching up only 0.8% month-over-month to 4.03 million, but still down 0.7% year-over-year. This capped off a disappointing spring season. The median sales price hit a new record for May at $422,800, up 1.3% year-over-year, showing that prices were still climbing despite lower sales activity. Mortgage rates averaged 6.82% for the month. Importantly, inventory continued to grow, sitting at 1.54 million units, up 20.3% from the previous year. This gave buyers more choices and time to consider their options, shifting the market from heavily seller-favored towards more balance. Affordability remained the main challenge, amplified by high prices and mortgage rates. Heightened economic uncertainty from earlier tariff actions continued to weigh on consumer confidence. While there was some optimism about potential interest rate cuts later in the year, experts predicted little immediate movement on mortgage rates.
  • June 2025: The year concluded its first half with a 2.7% decrease in existing-home sales month-over-month, landing at a seasonally adjusted annual rate of 3.93 million. Year-over-year, sales were actually unchanged. Inventory saw a slight dip to 1.53 million units, representing a 4.7-month supply. The median existing-home price reached a record high for June at $435,300, up 2% from the previous year—celebrating the 24th consecutive month of year-over-year price increases. NAR Chief Economist Lawrence Yun highlighted that while homeowners' wealth was growing, persistent undersupply and high mortgage rates were keeping sales stuck at cyclical lows. He noted that a drop in mortgage rates to 6% could lead to significantly more first-time homebuyers and increased sales activity. The data also showed individual investors retreating from the market, with cash sales and distressed sales remaining relatively steady.

Housing Market Predictions for the Rest of 2025: What the Data Tells Us

Looking at the trends from January to June 2025, here’s my take on what we can anticipate for the rest of the year and how we see the housing market predictions 2025 by Norada Real Estate playing out:

1. Mortgage Rates: A Slow and Steady Decline

The data consistently points to mortgage rates as the primary driver of market activity. Throughout the first half of 2025, rates hovered predominantly in the upper 6% to nearly 7% range. However, the projections from NAR Chief Economist Lawrence Yun suggest a more favorable environment in the latter half of the year, with rates expected to average 6.4% in the second half.

  • My Opinion: From my perspective at Norada Real Estate, this projected dip, even if gradual, is crucial. It's not a dramatic drop, but it's enough to start luring more buyers back who have been priced out or hesitant due to high borrowing costs. A move from, say, 6.7% down to 6.4% can make a significant difference in monthly payments, potentially unlocking demand that has been suppressed. We’ll be watching for any shifts in Federal Reserve policy for cues on this trend.

2. Home Sales: A Flicker of Recovery

Existing-home sales experienced a volatile start to 2025, with ups and downs. The overall pace has been somewhat sluggish, with April and May showing the slowest paces for those months in years. However, the projected moderation in mortgage rates is expected to bring a more positive trend. NAR forecasts existing-home sales to rise by 6% in 2025. While the Realtor.com forecast suggests sales might land at 4 million, just behind 2024’s long-term low, this still points to a market that isn't actively declining.

  • My Opinion: I believe that the underlying demand for homeownership remains strong. Many people still aspire to own a home. As affordability improves slightly with lower rates and prices moderate their growth, we should see more transactions. The increase in inventory throughout the first half also means buyers have more choices, which can facilitate sales. We might see a stronger finish to the year than the first half implied, especially in the fall selling season if those rate drops materialize.

3. Home Prices: Continued Growth, But at a Slower Pace

Despite any monthly fluctuations, the median home price continued to climb year-over-year throughout the first half of 2025, even reaching record highs for specific months. NAR predicts a modest 3% rise in median home prices for 2025. Realtor.com forecasts a similar +2.5% growth. This indicates that while the rapid price appreciation seen in previous years has cooled considerably, prices are unlikely to fall significantly.

  • My Opinion: This sustained price growth is largely due to the ongoing housing supply shortage. While inventory has increased, it's still below pre-pandemic levels. When demand picks up, even moderately, the limited supply will continue to put upward pressure on prices. However, the higher mortgage rates are acting as a natural brake on extreme price escalation. We're moving towards a more sustainable appreciation rate, which is healthier for the long-term market. Buyers shouldn't expect massive price drops, but the days of bidding wars on every single property might be less common.

4. Inventory: A Buyer's Best Friend (or at Least a Friendly Acquaintance)

The supply of homes for sale has been steadily increasing. By June 2025, inventory stood at 1.53 million units, up significantly from the previous year. This has led to a longer supply of months, moving towards a more balanced market.

  • Expert Opinion: This is perhaps one of the most significant shifts we're observing. For years, the challenge was finding a home. Now, while affordability is still a concern, buyers have more options and more time to make decisions. This is a welcome change for many. The increase in inventory is a direct result of slower sales and, perhaps, some homeowners who held off on selling being more confident as the year progressed. As the market rebalances, buyers will likely have more negotiating power, especially on properties that aren't priced perfectly or require some work.

5. Regional Variations: The Divergence Continues

We observed clear differences in market performance across the country. The Northeast and Midwest generally saw stronger price appreciation and modest sales growth, while the South and West experienced slight price declines and weaker sales for parts of the first half.

  • My Opinion: This is a trend I expect to continue. Local economic conditions, job growth, cost of living, and even local housing policies all play a significant role. For instance, areas with strong job markets and more affordable entry points might see more resilience. We’ll continue to advise clients to look closely at specific regional data rather than relying solely on national averages when making their real estate decisions.

Housing Market

2025 Predictions
📊
6.4%
Mortgage Rates
📈
+6%
Home Sales
💰
+3%
Price Growth
🏠
1.53M
Inventory

Key Market Trends

Rates declining from 7% peak
More buyer options available
Sustainable price growth
Regional market variations
Norada Real Estate Investments
Market Analysis & Predictions

Insight Beyond the Numbers

As someone who lives and breathes real estate every day, I can tell you that the numbers only tell part of the story. The sentiment of buyers and sellers, the stability of the economy, and even geopolitical events can all influence the market.

  • The “American Dream” Factor: Despite financial considerations, homeownership remains a significant goal for many Americans. This underlying demand is a powerful force that will continue to support the market, even through challenging economic periods.
  • The Impact of Home Construction: Lawrence Yun mentioned that home construction continues to lag population growth. This persistent undersupply is a foundational issue that will keep a floor under prices. Any significant increase in new construction would dramatically change the dynamics, but that's a longer-term solution.
  • Investor Behavior: The decrease in individual investor activity noted in the June report is also telling. Investors often pull back when markets are uncertain or when opportunities elsewhere seem more attractive. This can be a signal that the market is becoming more grounded in owner-occupier demand.

Looking Ahead: The Key Levers for the Rest of 2025

Based on everything we've observed and the projections from leading sources, the critical factors that will shape the remainder of 2025 are:

  • Mortgage Rate Stability/De cline: Will rates continue their downward trend as predicted? Any deviation from this could significantly alter buyer behavior.
  • Inflation and Economic Stability: While tariff-related uncertainty seemed to cause a mid-spring dip in confidence, continued economic stability is vital for sustained buyer confidence and market health.
  • Inventory Levels: Will the increase in supply continue, offering buyers more breathing room, or will sales activity pick up enough to absorb it?

Summary: A Market of Adjustment and Opportunity

The housing market predictions 2025 by Norada Real Estate paint a picture of a market that is adjusting, not collapsing. While the first half presented challenges, particularly around affordability and economic uncertainty, the second half could see a more positive trajectory. Mortgage rates are expected to move lower, inventory is higher, and while prices are still appreciating, it’s at a more sustainable pace.

For those looking to buy, this period of increased inventory and potentially more balanced negotiations presents an opportune moment to enter the market, provided they maintain financial discipline. For sellers, it’s a time for realistic pricing, strong presentation, and working with experienced professionals to navigate the evolving conditions.

At Norada Real Estate, we believe that understanding these trends is the first step toward making sound real estate decisions. We’re excited to see how the market unfolds and ready to help you capitalize on the opportunities that arise in the latter half of 2025.

Invest in Real Estate in the Top U.S. Markets

Discover high-quality, ready-to-rent properties designed to deliver consistent returns.

Contact Norada today to expand your real estate portfolio with confidence.

Contact our investment counselors (No Obligation):

(800) 611-3060

Get Started Now 

Also Read:

  • Housing Market Predictions 2025 by Warren Buffett's Berkshire Hathaway
  • Will the Housing Market Crash in 2025: What Experts Predict?
  • Housing Market Predictions 2026: Will it Crash or Boom?
  • Housing Market Predictions for the Next 4 Years: 2025 to 2029
  • 12 Housing Markets Set for Double-Digit Price Decline by Early 2026
  • Real Estate Forecast: Will Home Prices Bottom Out in 2025?
  • Real Estate Forecast Next 5 Years: Top 5 Predictions for Future
  • 5 Hottest Real Estate Markets for Buyers & Investors in 2025
  • Will Real Estate Rebound in 2025: Top Predictions by Experts
  • Will the Housing Market Crash Due to Looming Recession in 2025?
  • 4 States Facing the Major Housing Market Crash or Correction
  • New Tariffs Could Trigger Housing Market Slowdown in 2025
  • Real Estate Forecast Next 10 Years: Will Prices Skyrocket?
Filed Under: Housing Market, Real Estate Market Tagged With: Housing Market, housing market predictions, Housing Price Forecast

  • « Previous Page
  • 1
  • …
  • 5
  • 6
  • 7
  • 8
  • 9
  • …
  • 15
  • Next Page »

Real Estate

  • Birmingham
  • Cape Coral
  • Charlotte
  • Chicago

Quick Links

  • Markets
  • Membership
  • Notes
  • Contact Us

Blog Posts

  • Mortgage Rates Predictions for the Next 12 Months: Sept 2025 to Sept 2026
    September 25, 2025Marco Santarelli
  • Today’s Mortgage Rates – September 25, 2025: Home Loan and Refinance Rates Rise
    September 25, 2025Marco Santarelli
  • Mortgage Rates Rise Following Several Weeks of Decline
    September 25, 2025Marco Santarelli

Contact

Norada Real Estate Investments 30251 Golden Lantern, Suite E-261 Laguna Niguel, CA 92677

(949) 218-6668
(800) 611-3060
BBB
  • Terms of Use
  • |
  • Privacy Policy
  • |
  • Testimonials
  • |
  • Suggestions?
  • |
  • Home

Copyright 2018 Norada Real Estate Investments

Loading...