Mortgage refinance rates edged higher on Tuesday, February 24, 2026, with the popular 30-year fixed averaging 6.49% — up 6 basis points from last week, according to Zillow data. While the move is modest, it signals that borrowing costs may be stabilizing after recent declines. The 15-year fixed held steady at 5.52%, and 5-year ARM rates were unchanged at 7.01%, giving borrowers some consistency even as longer-term rates tick higher.
Mortgage Rates Today, February 24: 30-Year Refinance Rate Rises by 6 Basis Points
A Gentle Nudge Upward: What This Means for You
| Mortgage Type | Rate (Feb 24, 2026) | Change from Last Week | Previous Week's Average (Approx.) | Key Benefit |
|---|---|---|---|---|
| 30-Year Fixed | 6.49% | +6 basis points | 6.43% | Long-term payment stability, predictable costs |
| 15-Year Fixed | 5.52% | Unchanged | 5.52% | Faster payoff, lower total interest paid |
| 5-Year ARM | 7.01% | Unchanged | 7.01% | Potentially lower initial payment (though not this time) |
This week's data from Zillow shows a subtle shift, particularly with that 30-year fixed refinance rate nudging up. Now, I'm not one to sound alarm bells over a few basis points – that’s a term we use for a hundredth of a percent, so 6 basis points is just 0.06%! – but it does suggest that lenders are carefully adjusting their offerings as they watch the economic signals.
What strikes me is how stable the 15-year fixed and the 5-year adjustable-rate mortgages (ARMs) are. This tells me that while the longer-term outlook for the 30-year fixed might be under slight pressure from various factors, the shorter-term and more flexible options are in a holding pattern for now. This stability in certain segments could be a good thing for borrowers who are more sensitive to immediate payment changes or who prefer shorter commitment periods.
Digging Deeper: The Market Forces at Play
So, why the slight increase in the 30-year fixed refi rate? It’s a combination of things, and as someone who watches this market closely, I see it as lenders reacting to broader economic trends and future expectations.
- The Fed's Balancing Act: Remember how the Federal Reserve has been making moves to cool inflation? They held interest rates steady at around 3.6% in their January 2026 meeting. What’s really interesting is what Fed Governor Christopher Waller said recently. He called the decision for the March meeting a “coin flip,” meaning it heavily depends on upcoming job market data. This uncertainty is a big driver for interest rates. If the job market stays strong, it might signal that the economy is robust, and the Fed might be slower to cut rates, which can put upward pressure on borrowing costs.
- A Refi Boom on the Horizon? Here’s a fascinating trend: refinance applications are expected to jump by over 30% this year! Why? Because a significant chunk of homeowners are still holding mortgages with rates above 6%. Imagine having an $181,000 home equity line available as of mid-2025 – and if you can lop off a decent percentage from your monthly payment by refinancing, it’s a no-brainer for many. This surge in demand can also indirectly influence rates as lenders manage their pipelines.
- “The Great Housing Reset” is Stabilizing: Most forecasts for 2026 point towards a period of calm in the housing market. We're not expecting wild price swings. Home prices are predicted to see modest growth, around 1% to 2.2%. What’s really encouraging is that wage growth is projected to hit 3.5%, finally outpacing inflation. This is huge because it means people's money goes further, and owning a home becomes more manageable. This improved affordability can reduce immediate downward pressure on rates driven by desperation.
- Cash is King (or at least, Equity is): Many homeowners have built up substantial equity in their homes, especially from the boom years. As of mid-2025, the average homeowner had about $181,000 in untapped equity. This is why cash-out refinances are becoming increasingly popular. People are using this equity to fund renovations, consolidate debt, or even make other investments. This demand for cash-out might also play a role in how lenders price their offerings.
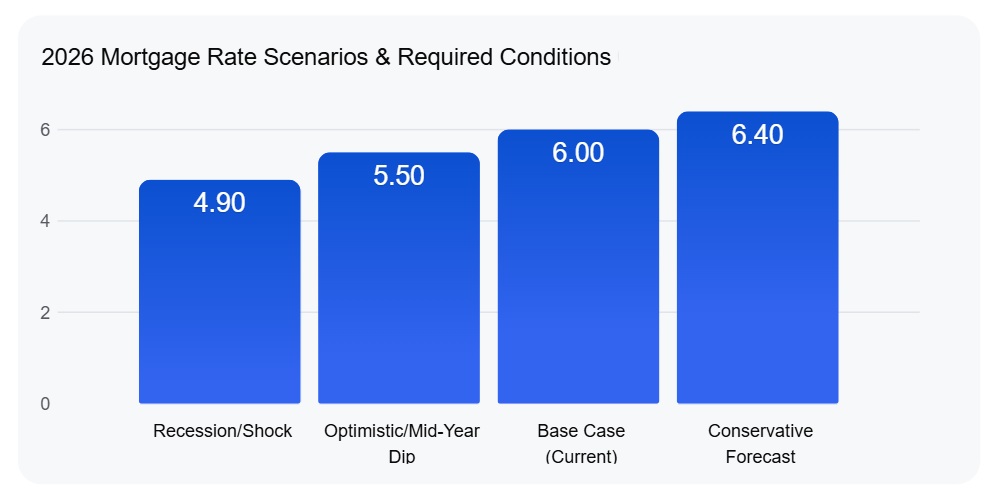
Looking Ahead: What the Experts Predict
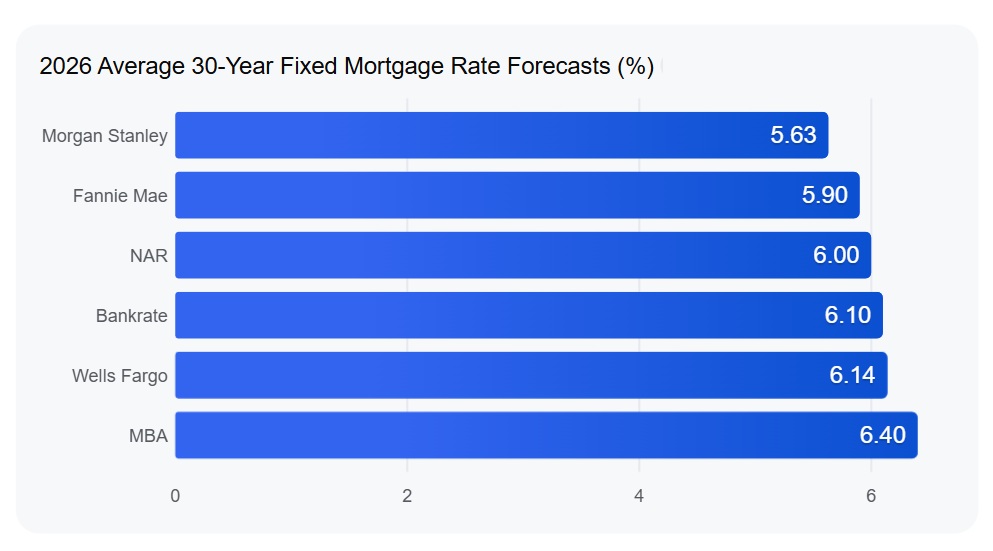
When I talk to my colleagues in the mortgage industry, the general sentiment for the rest of 2026 is one of predictability. Forecasters like those at the Mortgage Bankers Association and Fannie Mae are putting the 30-year fixed rate right around the 6% to 6.1% mark for the remainder of the year.
Some sharp minds, like the analysts at Morgan Stanley, are even suggesting a potential dip towards 5.75% by mid-2026. However, they also foresee rates potentially inching back up in 2027. This outlook suggests that while we might not see dramatic drops, there's potential for a slight dip before a gradual rise. It's a window of opportunity for those looking to secure a competitive rate.
Your Refinance Options Today: A Quick Breakdown
Let's quickly revisit what these rates mean for your typical refinancing choices:
- 30-Year Fixed at 6.49%: This is still the go-to for a lot of people because it offers the most predictable monthly payment over a long period. Even with the slight increase, it's a solid choice if you value stability and want to spread your payments out. For many, it's a significant improvement over the higher rates seen in past years.
- 15-Year Fixed at 5.52%: If you're looking to pay off your mortgage faster and save big on interest over time, this rate is incredibly attractive. You’ll have a higher monthly payment than the 30-year, but the overall interest you pay will be much less. This is often a great option for those who can comfortably afford the higher payments.
- 5-Year ARM at 7.01%: Honestly, at this rate, the 5-year ARM is less appealing for most borrowers seeking affordability right now. ARMs typically start lower than fixed rates to attract borrowers, but this one is priced higher. They're usually best for people who plan to move or refinance again before the fixed period ends, or who have a strong belief that rates will drop significantly in the future.
My Two Cents: What Borrowers Should Really Think About
From my perspective, the key takeaway for anyone considering a refinance today is that the market is in a stable-ish phase. The slight uptick in the 30-year fixed rate isn't a sign of panic, but rather a sign of thoughtful adjustments.
Think about your personal financial goals.
- Are you looking for long-term payment predictability? The 30-year fixed is still your friend. Lock it in for peace of mind.
- Do you want to be mortgage-free sooner and save on interest? That 15-year fixed rate at 5.52% is a fantastic opportunity.
- Are you someone who likes to plan for short-term ownership or believes rates will drop dramatically soon? Then an ARM might be a consideration, but you need to be extra sure about the math and the risks given the current pricing.
It’s also crucial to remember that these are national averages from Zillow. Your specific rate will depend on your credit score, loan-to-value ratio, and the specific lender you choose. So, shop around! Getting quotes from multiple lenders can make a surprising difference. Don't just look at the rate; also consider the closing costs and fees associated with each refinance option.
and
Florida’s modern build with strong cash flow vs Missouri’s affordable rental with higher cap rate. Which fits YOUR investment strategy?
We have much more inventory available than what you see on our website – Let us know about your requirement.
📈 Choose Your Winner & Contact Us Today!
Speak to Our Investment Counselor (No Obligation):
(800) 611-3060
Market forecasts suggest steady demand, making turnkey real estate one of the most reliable paths to passive income and wealth creation.
Norada Real Estate helps investors capitalize on these trends with turnkey rental properties designed for appreciation and consistent cash flow—so you can grow wealth securely while others wait for clarity in the market.
Recommended Read:
- 30-Year Fixed Refinance Rate Trends – February 22, 2026
- Best Time to Refinance Your Mortgage: Expert Insights
- Should You Refinance Your Mortgage Now or Wait Until 2026?
- When You Refinance a Mortgage Do the 30 Years Start Over?
- Should You Refinance as Mortgage Rates Reach Lowest Level in Over a Year?
- Half of Recent Home Buyers Got Mortgage Rates Below 5%
- Mortgage Rates Need to Drop by 2% Before Buying Spree Begins
- Will Mortgage Rates Ever Be 3% Again: Future Outlook
- Mortgage Rates Predictions for Next 2 Years
- Mortgage Rate Predictions for Next 5 Years