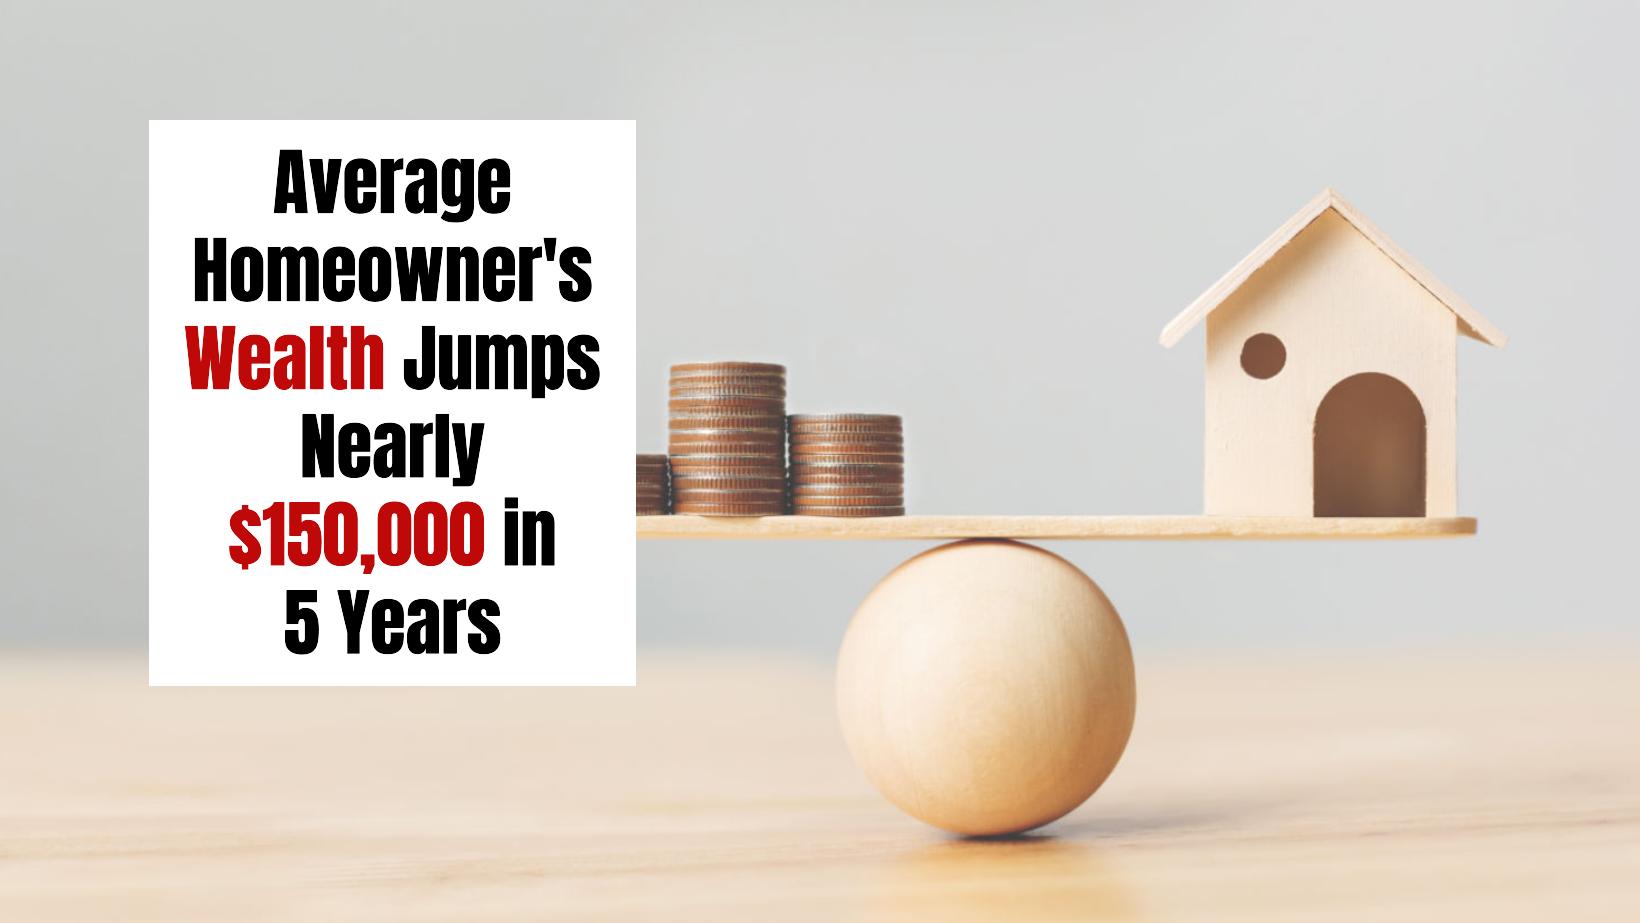
Did you know homeowner wealth has surged by nearly $150k in the last 5 years? The US housing market has been a rollercoaster ride over the past few years. The pandemic initially caused a slowdown, but it was followed by a period of unprecedented demand, leading to sharp price increases and a competitive landscape for buyers. We've seen home prices climb significantly, enriching many homeowners but also making it harder for first-time buyers to enter the market.
However, in recent quarters, we've witnessed a change in trajectory. The pace of price appreciation has slowed down. According to the National Association of REALTORS® (NAR), the national median home price increased by 3.1% year-over-year in the third quarter of 2024, a slowdown from the 5% increase seen in the second quarter. While prices are still elevated, the deceleration suggests a potential shift toward a more balanced market.
Key Takeaways
- The US housing market is shifting from a period of rapid price appreciation to a more stable environment.
- Homeowner equity has risen significantly over the past five years, enriching many homeowners.
- Mortgage rates have decreased, leading to improvements in housing affordability.
- Housing inventory is increasing, easing some of the pressure on buyers.
- First-time homebuyers still face challenges but are seeing slightly improved conditions.
- The US housing market is diverse across different regions, with California being the most expensive and certain areas of the Midwest experiencing strong growth.
Housing Market Report: $147K Wealth Surge for Average Homeowner
Over the last five years, the average homeowner has accumulated nearly $147,000 in housing wealth. This substantial increase in equity is a significant factor in the current state of the market. It's fueled by the strong appreciation of home prices, which has boosted the net worth of many homeowners. This wealth accumulation has had a positive impact on the economy, as homeowners have more financial resources available to spend on other goods and services. However, it has also exacerbated the challenges faced by prospective homebuyers, particularly first-time buyers.
The National Association of REALTORS® (NAR) has consistently been tracking this housing wealth accumulation. Their data shows that nearly 90% of major U.S. metro areas saw home price increases in the third quarter of 2024, highlighting the widespread nature of this trend. It's important to note that this period of rapid price appreciation was not uniform across all markets. Some areas, particularly in the Midwest, experienced particularly strong gains. For instance, cities like Racine, Wisconsin, and Youngstown, Ohio, saw double-digit year-over-year increases.
The Impact of Mortgage Rates on Housing Affordability
One of the key factors impacting the US housing market is the fluctuation of mortgage interest rates. In recent years, we've seen significant changes in the rate environment. Prior to 2024, mortgage rates had been steadily rising, reaching a peak of above 7% at one point. This had a chilling effect on affordability, as higher rates led to increased monthly mortgage payments.
However, the 30-year fixed-rate mortgage has since averaged in the mid-6% range. This decline in rates has played a crucial role in improving affordability. For example, the monthly mortgage payment on a typical existing single-family home with a 20% down payment decreased by 2.4% year-over-year in the third quarter.
This reduction in mortgage payments has provided some relief to potential buyers. However, it's important to remember that the absolute level of mortgage payments remains high due to the substantial increases in home prices over the past few years. It's essential for potential homebuyers to carefully evaluate their financial situation and affordability before entering the market.
Recommended Read:
Inventory Levels and Their Impact on Competition
For a long time, low inventory levels were a major factor driving up home prices in the US housing market. Buyers were competing for a limited number of homes, pushing prices higher. But in recent months, there have been some signs that the inventory situation is starting to improve.
More homes are entering the market, giving buyers a wider selection of properties to choose from. This increased inventory is helping to alleviate some of the competitive pressure that buyers have faced in recent years. However, the inventory levels still vary significantly across the country. Some markets remain tight, particularly in highly desirable locations.
Challenges for First-Time Home Buyers
First-time homebuyers have been facing significant challenges in navigating the US housing market. They often lack the equity advantage that established homeowners have, making it more difficult to compete in the market. The share of first-time buyers in the market has shrunk to record lows, accounting for only about 24% of transactions, whereas the typical share is around 40%.
While the situation has gradually improved as mortgage rates have declined, first-time buyers still need to be strategic and well-prepared. They may need larger down payments and are often finding that they need to spend a greater portion of their income on mortgage payments compared to other buyers. I've witnessed many first-time buyers stretch their budgets to enter the market, sometimes compromising on location or features to remain within their affordability range.
The Role of Economic Factors
The US housing market is deeply intertwined with the overall health of the economy. Factors like employment rates, wage growth, and consumer confidence can significantly impact housing demand and affordability.
The robust job market that we've experienced in recent years has supported the demand for housing. As long as employment conditions remain strong, and wage growth keeps pace with inflation, the market is likely to remain relatively resilient. However, economic downturns can negatively impact the housing market, leading to reduced demand and potential price declines.
Geographic Variation in the US Housing Market
The US housing market is not uniform across the country. Different regions experience varying levels of demand, inventory, and price appreciation.
California consistently ranks among the most expensive states, with markets like San Jose, Anaheim, and San Francisco leading the way in terms of median home prices. However, even within California, there's a wide range of price levels, reflecting differences in local factors like job markets, population growth, and desirability.
The Midwest has also seen significant gains in certain areas, particularly in smaller markets like Racine, Wisconsin, and Peoria, Illinois. These areas have benefited from relatively affordable housing and a strong local economy.
Top 10 Markets with the Highest Price Gains
The following markets exhibited the largest year-over-year increases in median home prices in the third quarter of 2024:
| Rank | Metro Area | Year-over-Year Price Increase |
|---|---|---|
| 1 | Racine, WI | 13.7% |
| 2 | Youngstown-Warren-Boardman, OH-PA | 13.1% |
| 3 | Syracuse, NY | 13% |
| 4 | Peoria, IL | 12.4% |
| 5 | Springfield, IL | 12.3% |
| 6 | Burlington-South Burlington, VT | 11.7% |
| 7 | Shreveport-Bossier City, LA | 11.5% |
| 8 | Rockford, IL | 11.1% |
| 9 | Decatur, IL | 10.9% |
| 10 | Norwich-New London, CT | 10.6% |
These markets, many of which are located in the Midwest, show the regional variation in the housing market.
The Priciest Housing Markets in the US
The most expensive markets in the nation remain concentrated in California, highlighting the influence of factors like high incomes, desirable climates, and limited housing supply. Here are the top 10 most expensive housing markets as of the third quarter of 2024:
| Rank | Metro Area | Median Home Price | Year-over-Year Price Change |
|---|---|---|---|
| 1 | San Jose-Sunnyvale-Santa Clara, CA | $1.9 million | 2.7% |
| 2 | Anaheim-Santa Ana-Irvine, CA | $1.399 million | 7.2% |
| 3 | San Francisco-Oakland-Hayward, CA | $1.309 million | 0.7% |
| 4 | Honolulu, HI | $1.138 million | 7.2% |
| 5 | San Diego-Carlsbad, CA | $1.01 million | 3.2% |
| 6 | Salinas, CA | $959,800 | 1.5% |
| 7 | San Luis Obispo-Paso Robles, CA | $949,800 | 6.7% |
| 8 | Los Angeles-Long Beach-Glendale, CA | $947,500 | 5.6% |
| 9 | Oxnard-Thousand Oaks-Ventura, CA | $947,400 | 2.8% |
| 10 | Boulder, CO | $832,200 | -3% |
These markets illustrate the disparities in housing costs across the country. In many of these areas, the limited supply of housing and strong local economies have contributed to the high prices.
Also Read:
- Housing Market Forecast for the Next 2 Years: 2024-2026
- Housing Market Predictions for Next Year: Prices to Rise by 4.4%
- Housing Market Predictions for the Next 4 Years: 2024 to 2028
- Real Estate Forecast Next 5 Years: Top 5 Predictions for Future
- Real Estate Market Predictions 2025: What to Expect
- Is the Housing Market on the Brink in 2024: Crash or Boom?
- 2008 Forecaster Warns: Housing Market 2024 Needs This to Survive
- Housing Market Predictions for the Next 2 Years
- Real Estate Forecast Next 10 Years: Will Prices Skyrocket?
- Housing Market Predictions for Next 5 Years (2024-2028)
- Housing Market Predictions 2024: Will Real Estate Crash?
- Trump vs Harris: Which Candidate Holds the Key to the Housing Market (Prediction)


