Norada Real Estate Investments

  • Home
  • Markets
  • Properties
  • Membership
  • Podcast
  • Learn
  • About
  • Contact

Housing Market Distress Mounts as Foreclosure Activity Rises for Ninth Month in a Row

December 20, 2025 by Marco Santarelli

Housing Market Distress Mounts as Foreclosure Activity Rises for Ninth Month in a Row

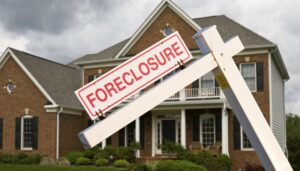
The U.S. housing market is showing clear signs of strain, with foreclosure filings increasing year-over-year for the ninth consecutive month, signaling a troubling shift for many homeowners and a potential inflection point for the real estate sector. This persistent rise in foreclosure activity, as reported by ATTOM, suggests that the economic pressures faced by a growing number of households are translating into tangible distress.

It’s hard not to feel a sense of unease when you see the numbers, and this latest report from ATTOM paints a picture that’s hard to ignore. For the ninth month straight, we’re seeing more homes going into some stage of the foreclosure process compared to the same time last year. This isn't just a blip; it's a trend. In November 2025, a total of 35,651 U.S. properties had foreclosure filings.

While this is a slight dip from October, it's a significant 21 percent jump from November of the previous year. When I look at this data, I see more than just numbers; I see families facing difficult decisions and a market that’s clearly under pressure.

Housing Market Distress Mounts as Foreclosure Activity Rises for Ninth Month in a Row

Why the Climb? Unpacking the Foreclosure Trend

As Rob Barber, CEO at ATTOM, points out, “Foreclosure starts were up 17 percent from last year and completed foreclosures rose 26 percent.” This indicates that more homeowners are falling behind on their payments and lenders are taking action. While these numbers are still lower than what we saw during the Great Recession, the consistent upward movement is a clear signal that the market is “normalizing,” as Barber puts it. But let’s be honest, for those directly affected, it feels more like a significant struggle against higher housing costs and shifting economic pressures.

From my perspective, several factors are likely contributing to this escalating trend:

  • Elevated Interest Rates: Many homeowners who bought or refinanced when interest rates were at historic lows are now facing much higher payments if they need to move or if their adjustable-rate mortgages reset. This can put a severe strain on household budgets.
  • Inflationary Pressures: The cost of everyday goods and services remains high, squeezing disposable income. When there's less money left after covering essential expenses, mortgage payments can become harder to manage.
  • Job Market Uncertainty: While the job market has shown resilience, there are pockets of instability. Layoffs and reduced hours can quickly lead to homeowners being unable to meet their financial obligations.
  • Stagnant or Declining Home Equity in Some Areas: In some regions, home price appreciation has slowed or even reversed. This can leave homeowners with little to no equity to tap into if they need cash, making it harder to stave off foreclosure.

Where is the Distress Most Pronounced?

The ATTOM report highlights specific states and metropolitan areas that are seeing the brunt of this foreclosure surge. It's important to look at these areas to understand the localized impacts.

States with the Worst Foreclosure Rates (November 2025):

State Foreclosure Rate (1 in X housing units)
Delaware 1,924
South Carolina 1,973
Nevada 2,373
New Jersey 2,511
Florida 2,565

Nationwide, one in every 3,992 housing units had a foreclosure filing. Seeing states like Delaware and South Carolina with rates more than double the national average is a serious concern. These aren't just statistics; they represent communities where people are struggling.

Among larger cities (metro areas with over 1 million people), Philadelphia, PA, recorded the highest foreclosure rate, with one filing for every 1,511 housing units. ATTOM notes this was partly due to a temporary spike from resumed data collection, which is expected to correct itself. However, other major metros also show significant distress:

  • Las Vegas, NV: 1 filing for every 2,013 housing units
  • Cleveland, OH: 1 filing for every 2,114 housing units
  • Orlando, FL: 1 filing for every 2,282 housing units
  • Tampa, FL: 1 filing for every 2,362 housing units

It’s interesting to note that even in these troubled areas, the overall volume of foreclosures remains historically lower than peak crisis times. This offers a sliver of hope, suggesting that perhaps more homeowners have built up equity or have better financial cushions than in the past.

Foreclosure Starts vs. Completed Foreclosures: What's the Difference?

It's crucial to understand the different stages of foreclosure.

  1. Foreclosure Starts: This is when lenders initiate the formal process, often with a notice of default or lis pendens. In November 2025, lenders started the foreclosure process on 23,720 U.S. properties. This is a 17 percent increase year-over-year.
  2. Completed Foreclosures (REOs – Real Estate Owned): This is when the lender repossesses the home. There were 3,884 completed foreclosures in November 2025, an increase of 26 percent from the previous year.

The fact that both starts and completions are rising indicates that the issue is widespread and moving through the pipeline at an accelerated pace.

States Leading in Foreclosure Starts (November 2025):

  1. Florida (2,819)
  2. Texas (2,612)
  3. California (2,090)
  4. New York (1,146)
  5. Illinois (1,075)

Interestingly, some major metropolitan areas, which typically see high numbers, actually experienced decreases in foreclosure starts compared to last year. For example, Boston, Miami, and Sacramento showed declines. This could suggest localized economic recovery in those specific urban centers, or perhaps more effective loss mitigation strategies being implemented there.

Looking Ahead: What Does This Mean for the Housing Market?

The steady rise in foreclosure activity is a strong indicator that the housing market is facing significant headwinds. As an observer of the real estate world, I see this as a natural, albeit painful, correction after years of rapid price growth and low interest rates.

  • Potential Increase in Available Inventory: As more homes enter the foreclosure process and are eventually repossessed, the supply of homes for sale could increase. This might help to stabilize or even slightly decrease home prices in some areas, which could be a welcome development for potential buyers struggling with affordability.
  • Impact on Home Prices: A sustained increase in supply, particularly of distressed properties, could put downward pressure on home prices. However, the extent of this impact will vary greatly by region, depending on local demand, economic conditions, and the sheer volume of foreclosures.
  • Opportunities for Investors: For those with the capital and expertise, rising foreclosures can present opportunities to acquire properties at a discount. However, this market requires careful due diligence and a solid understanding of the risks involved.
  • Challenge for Homeowners: For homeowners facing foreclosure, this is a deeply stressful time. It underscores the importance of proactive financial planning and seeking help from housing counselors or legal aid if needed.

While the situation is concerning, it’s important to remember that we are not in a widespread housing crisis on the scale of 2008. The market has more equity, and lending standards are generally tighter. However, the ongoing rise in foreclosure activity is a clear warning sign that we need to pay close attention to the economic well-being of homeowners and the stability of the housing market.

Secure Your Retirement with Cash-Flowing Rental Properties

Turnkey real estate offers a low-hassle way to generate passive income and build long-term financial security—perfect for retirement-focused investors.

Norada Real Estate helps you invest in stable, high-demand markets that deliver consistent monthly cash flow and equity growth over time.

🔥 HOT NEW LISTINGS JUST ADDED! 🔥

Talk to a Norada investment counselor today (No Obligation):

(800) 611-3060

Get Started Now

Want to Know More About Foreclosure Trends?

Explore these related articles for even more insights:

  • Zombie Foreclosures Decline Nationwide Amidst Peak Housing Demand
  • Housing Markets With the Highest Zombie Foreclosure Rates in 2025
  • 5 States Facing the Highest Foreclosure Rates in 2025
  • Housing Market Alert: Rising Foreclosures in 2025 Signal Deeper Trouble Ahead
  • Housing Markets With the Highest Zombie Foreclosure Rates in 2025
  • US Foreclosure Activity Drops by 10% in 2024: A Sign of Stability?
  • New Jersey Stands Out With Highest Foreclosure Rate Last Month
  • Is the Housing Market Recovering? A Look at Recent Trends
  • US Housing Market Sees Worst Year for Sales Since 1995
  • Nearly 100,000 U.S. Properties Faced Foreclosure Filings in Q1 2024

Filed Under: Foreclosures, Housing Market Tagged With: foreclosure, foreclosure rate, Housing Market, REO

Florida Housing Market Forecast for the Next 5 Years: 2026-2030

December 20, 2025 by Marco Santarelli

Florida Housing Market Forecast for the Next 5 Years: 2026-2030

The Florida housing market is set for steady growth and sustained demand over the next five years, from 2026 to 2030, thanks to a continued influx of new residents. Let's talk about Florida real estate. It's no secret that this state has been a hot spot for people looking to put down roots, retire, or simply enjoy a warmer climate. As someone who keeps a close eye on the market, I can tell you that the energy and optimism haven't faded. In fact, the latest insights from Florida Realtors® paint a very clear picture for the coming years.

Florida Housing Market Forecast for the Next 5 Years: 2026-2030

For those of you wondering what the Florida housing market forecast for the next 5 years holds, here's the bottom line: expect a robust and active market driven by a constant wave of new people calling Florida home.

The Engine of Growth: Why People Keep Moving to Florida

The biggest story, by far, is population growth. It's the main reason why Florida's housing market stays strong. Think about it: when more people arrive, they need places to live, whether that's buying a house or renting an apartment.

According to Dr. Brad O’Connor, the Chief Economist at Florida Realtors®, state economists have updated their projections. They now expect Florida to add roughly 305,953 new residents each year between April 1, 2026, and April 1, 2030. That's about 838 people every single day! To put that in perspective, it's like adding a new city the size of St. Petersburg, or almost Orlando, to the state annually.

This isn't just about people moving from afar; a lot of it is about people choosing Florida because of its lifestyle, job opportunities, and welcoming atmosphere. While we might see more people retiring and some natural population changes, the sheer volume of folks relocating to Florida is what really fuels the housing demand.

What This Means for Housing Demand

This continuous population surge translates directly into steady demand for both homes for sale and rental properties. Dr. O’Connor highlighted that this growth means Florida's housing market is “primed for long-term growth.”

I’ve seen it myself – even when interest rates have nudged up and made buying a bit tougher, the underlying desire to live in Florida hasn't disappeared. In fact, Dr. O’Connor mentioned that this “enormous amount of latent housing demand” is starting to show itself. We've seen a positive trend of rising home sales since interest rates began to ease in August. This is the first time we’ve seen such a sustained increase since 2021, which tells me that folks are ready to make their Florida move.

A Look at the Numbers: Key Population Growth Projections (2026-2030)

Here’s a breakdown of what the Florida Realtors® projections suggest for population changes:

Period Estimated Annual Net New Residents Annual Growth Rate
April 2026 – April 2027 ~305,953 ~1.28%
April 2027 – April 2028 ~305,953 ~1.28%
April 2028 – April 2029 ~305,953 ~1.28%
April 2029 – April 2030 ~305,953 ~1.28%

Note: These are average annual projections based on the Florida Demographic Estimating Conference.

This consistent growth means that the pressure on the housing supply will likely remain.

Beyond Growth: Nuances in the Market

While the overall trend is positive, it’s important to understand that the market isn't a monolith. Growth, while strong, is expected to gradually slow down over time. The projections show year-over-year population gains easing, and by 2032, the growth rate might drop below 1%. This is natural as the population ages.

However, even with this gradual deceleration, the overall numbers are substantial. For those of us working in real estate, this outlook offers a consistent stream of opportunities. We can expect continued activity in:

  • New Construction: Building homes to meet the demand from newcomers.
  • Move-Up Purchases: People who already live in Florida upgrading to new homes.
  • Downsizing: Retirees or empty-nesters trading larger homes for smaller, perhaps more manageable, ones.
  • Second Homes: Florida continues to be a prime spot for vacation and investment properties.

The areas poised for the strongest activity will likely be places where jobs are booming, lifestyle amenities are plentiful, and there’s that special appeal for retirees. Think of the popular coastal cities, the vibrant central Florida hubs, and even some of the up-and-coming inland communities.

My Take: Staying Grounded in Opportunity

From my perspective, the Florida housing market forecast for 2026-2030 is overwhelmingly positive, grounded by fundamental drivers like population growth. It’s not just about the numbers; it's about the enduring appeal of the Sunshine State.

Of course, affordability remains a key factor, and we'll continue to navigate that. As a real estate professional, my advice is to stay informed, understand your local market conditions, and be ready for the ongoing opportunities. The demand is there, and it's expected to stay strong. Whether you're looking to buy, sell, or invest, the next five years in Florida look promising.

Florida’s Market Is Shifting—Investors Are Staying Ahead

From Cape Coral to Jacksonville, Florida’s housing market is evolving—but turnkey investors are locking in cash-flowing properties while prices and rents remain favorable.

Norada Real Estate helps you navigate Florida’s changing landscape with fully managed rental properties in high-demand cities—so you can build passive income and long-term equity with confidence.

🔥 NEW FLORIDA LISTINGS JUST ADDED! 🔥

Talk to a Norada investment counselor today (No Obligation):

(800) 611-3060

Get Started Now

Want to Know More About the Florida Housing Market?

Explore these related articles for even more insights:

  • Best Places in Florida to Invest in Real Estate in 2026
  • Florida Housing Market: Home Price Forecast for 2026
  • Multiple Florida Housing Markets Are on the Brink of a Crash in 2026
  • Florida Condos Hit Hardest Since the Great Recession as Prices Tumble
  • Florida Leads Among the Fastest Cooling Housing Markets of 2025
  • Florida Housing Market Predictions Over the Next One Year
  • Florida Housing Market Trends: 4 Cities Turn Buyer-Friendly in 2025
  • Florida Housing Market Sees a Major Shift With a Jump in Pending Sales
  • Florida Housing Prices Drop for the Fifth Consecutive Month in 2025
  • Is the Florida Housing Market on the Edge of a Crash or Downturn?
  • 24 Florida Housing Markets Could See Home Prices Drop by Early 2026
  • Tax Relief Proposed as Florida Housing Market Faces Deepening Crisis
  • Florida Housing Market: Record Supply Expected to Favor Buyers in 2025
  • Florida Housing Market Forecast for Next 2 Years: 2025-2026
  • Florida Housing Market: Predictions for Next 5 Years (2025-2030)

Filed Under: Housing Market, Real Estate Market Tagged With: Florida, Florida Condos, Housing Market

Housing Market Sees a Surprising Burst of Sales Activity in November 2025

December 19, 2025 by Marco Santarelli

Housing Market Sees a Surprising Burst of Sales Activity in November 2025

The housing market showed a surprising burst of activity in November, with existing-home sales nudging up by a modest 0.5%. This small increase signals a potential shift in momentum, offering a glimmer of optimism for buyers and sellers alike.

Here's the bottom line: Existing-home sales saw a 0.5% increase in November, reaching a seasonally adjusted annual rate of 4.13 million units, according to the National Association of REALTORS® (NAR). It’s been a bit of a rollercoaster for the housing market lately, and this bit of good news is definitely something to pay attention to.

As someone who lives and breathes real estate, I’ve been watching these numbers closely. It feels like we’ve been in a bit of a holding pattern, with both buyers and sellers trying to figure out their next move. So, this uptick in November? It tells me that despite the challenges, people are still making the decision to buy and sell homes.

Housing Market Sees a Surprising Burst of Sales Activity in November 2025

What’s Driving This November Sales Boost?

The main engine behind this sales increase, according to NAR Chief Economist Lawrence Yun, is the dip in mortgage rates we saw this past autumn. When borrowing money to buy a home becomes a little cheaper, it opens the door for more people to make that big purchase. It's like a gentle nudge, making those monthly payments a bit more manageable.

  • Mortgage Rates Cool Down: The average 30-year fixed-rate mortgage in November was around 6.24%. That’s down from 6.81% a year ago, and even a hair less than the previous month. This is a significant factor. Lower rates mean buyers can potentially afford more house, or at least feel more comfortable with their monthly commitment.
  • Wage Growth Helping Affordability: Another positive sign is that wage growth is outpacing home price increases. This is a crucial point. It means that, on average, people are earning more relative to the cost of homes, which can make affording a place a little easier.

Inventory: A Bit of a Sticking Point

While sales went up, the number of homes available for sale (inventory) took a bit of a dive. It decreased by 5.9% from October, leaving us with 1.43 million units. This is equivalent to a 4.2-month supply, which is down from last month.

What does this mean? It suggests that more homes are selling faster than new ones are coming onto the market. This can lead to more competition among buyers, potentially driving up prices in some areas. Lawrence Yun’s point that “inventory growth is beginning to stall” is really important to note. When there aren't enough homes, it creates a seller's market, which can be tough for those looking to buy.

I see this firsthand. When a good property hits the market now, it often gets multiple offers and sells quickly. Homeowners who have equity are often sitting on their properties, enjoying the wealth they've built over the years, and might not feel the urgency to sell, especially during the winter months.

A Look Around the Country: Regional Differences

The housing market isn’t a one-size-fits-all situation. Different parts of the country are experiencing different trends:

  • Northeast and South See Sales Growth: Both the Northeast and the South reported increases in month-over-month sales. The Northeast saw a 4.1% jump, while the South saw a 1.1% increase. Year-over-year, sales were unchanged in these regions.
  • Midwest and West Show Declines: The Midwest experienced a 2.0% decrease in sales from October to November, and the West remained flat month-over-month, though down year-over-year.
  • Price Trends Vary:
    • The Northeast saw a 1.1% increase in median prices.
    • The Midwest saw a more significant 5.8% increase year-over-year in median prices.
    • The South also saw a modest 0.8% increase.
    • Interestingly, the West experienced a slight 0.9% decrease in its median price year-over-year, with the median price in November sitting at $618,900. This could be a very small sign of cooling in one of the traditionally hottest markets.

Here’s a quick rundown of the regional picture:

Region Month-over-Month Sales Change Year-over-Year Sales Change Median Price (Nov 2025) Year-over-Year Price Change
Northeast +4.1% Unchanged $480,800 +1.1%
Midwest -2.0% -3.0% $319,400 +5.8%
South +1.1% Unchanged $361,000 +0.8%
West 0.0% -1.3% $618,900 -0.9%

Single-Family Homes Still Leading the Pack

When we break down the sales by housing type, single-family homes continued to be the stronger segment. They saw a 0.8% increase in sales month-over-month. Condominiums and co-ops, on the other hand, saw a 2.6% decrease in sales, both month-over-month and year-over-year.

This trend aligns with what I often advise clients. Single-family homes offer more space and privacy, which are often highly sought after. While condos can be more affordable upfront, buyers need to factor in those monthly condo association fees, which are also rising and can add up. Remember, the median price for a condo was significantly lower than for a single-family home, but those ongoing fees are a crucial part of the total cost of ownership.

🏡 Which Rental Property Would YOU Invest In?

Lebanon, TN
🏠 Property: Wren Way Lot 420
🛏️ Beds/Baths: 3 Bed • 2 Bath • 1618 sqft
💰 Price: $349,900 | Rent: $2,100
📊 Cap Rate: 5.4% | NOI: $1,571
🏆 Neighborhood: A

VS

Jacksonville, FL
🏠 Property: Pangola Dr
🛏️ Beds/Baths: 4 Bed • 4 Bath • 2076 sqft
💰 Price: $411,900 | Rent: $2,498
📊 Cap Rate: 4.3% | NOI: $1,483
🏙️ Neighborhood: B-

Both properties are 2025 builds with strong cash flow potential. Which one fits YOUR investment strategy?

📈 Choose Your Winner & Contact Us Today!

Talk to a Norada investment counselor (No Obligation):

(800) 611-3060

Contact Us Now


Who’s Buying and How Are They Paying?

Let’s look at the buyers and their purchasing habits:

  • First-Time Buyers: The percentage of sales to first-time homebuyers remained steady at 30%. This is an important statistic because new homeowners are essential for a healthy market.
  • Cash Sales: Cash sales accounted for 27% of transactions, which is down slightly from the previous month but up from a year ago. This indicates that some buyers, perhaps those with significant equity or wealth, are still choosing to pay in cash.
  • Individual Investors: We saw an increase in sales to individual investors or second-home buyers, making up 18% of transactions. This suggests that some investors see opportunities in the market, perhaps anticipating future appreciation.
  • Distressed Sales: Thankfully, distressed sales (foreclosures and short sales) remain at historic lows, at just 2%. This is a very positive sign for the stability of the market, showing fewer people are in a situation where they are forced to sell their homes at a loss.

Time on Market: Things Are Slowing Down Slightly

Homes are staying on the market a bit longer. The median time on market was 36 days, which is up from 34 days last month and 32 days a year ago. This slight increase in how long homes are available might give buyers a little more breathing room to make decisions, but it’s still a relatively quick sales pace overall.

My Take on These Numbers

What I’m seeing here is a market that’s trying to find its footing. The lower mortgage rates have certainly provided a welcome boost. It’s encouraging to see sales tick up for three months straight. However, the tight inventory is a persistent challenge. If we don’t see more homes coming onto the market soon, it could put a damper on future sales growth, even with favorable mortgage rates.

The fact that wage growth is keeping pace with home prices is a critical piece of the affordability puzzle. This is what helps to keep the dream of homeownership alive for many. But we always have to be mindful of the balance. Too much of a price increase without corresponding wage growth can quickly make homes unaffordable again.

I think the November report gives us a nuanced picture. It’s not a runaway market, but it’s also not a market that’s collapsing. It’s a market that’s adapting, and where smart buyers and sellers can still find opportunities.

Looking Ahead

The housing market is always influenced by broader economic factors. Continued stability in mortgage rates and a healthy job market will be key to sustaining this positive sales trend. We also need to keep an eye on whether more homeowners will feel encouraged to list their properties as we move into the spring market.

Overall, the November numbers from NAR offer a reason for cautious optimism. The rise in sales, driven by more affordable borrowing costs, is a good sign, but the ongoing inventory constraints are definitely something to watch as we progress through the coming months.

2026 Housing Market for Investors

Analysts project steady growth in select U.S. markets, with affordability shifts and rental demand shaping investor strategies in 2026.

Norada Real Estate helps investors leverage turnkey rental properties to capture cash flow and appreciation—positioning portfolios for strength in the year ahead.

🔥 HOT 2026 INVESTOR LISTINGS JUST ADDED! 🔥
Talk to a Norada investment counselor today (No Obligation):
(800) 611-3060

Get Started Now

Want to Know More About the Housing Market Trends?

Explore these related articles for even more insights:

  • 10 Housing Markets Predicted to See Rapid Price Decline in 2026
  • Housing Market Predictions for 2026 Show a Modest Price Rise of 1.2%
  • Housing Market Predictions 2026 for Buyers, Sellers, and Renters
  • Why Are Home Prices Dropping in Over Half of Major US Cities in 2025?
  • Redfin's Bold Predictions About The Great Housing Market Reset in 2026
  • 5 Most Expensive Housing Markets Are Now Seeing the Biggest Price Cuts
  • Housing Market Predicted to See Strong Growth in 2026: Expert Forecast
  • Housing Market Predictions for the Next 12 Months by Zillow
  • Housing Market Regains Ground as Falling Mortgage Rates Unlock Buyer Savings
  • Hidden Costs of Homeownership Now Add Up to Nearly $16,000 a Year
  • Small Investors Dominate the Housing Market From Detroit to Vegas
  • Housing Market Predictions for the Next 4 Years: 2025 to 2029
  • Housing Market 2025 Splits Between Wealthy Buyers and First-Timers
  • Housing Markets at Risk of Double-Digit Price Decline Over the Next 12 Months
  • Will the Housing Market Shift to a Buyer’s Market in 2026?
  • Mid-Atlantic Housing Market Heats Up as Mortgage Rates Go Down

Filed Under: Housing Market, Real Estate Market Tagged With: Housing Market, Housing Market Trends

Housing Market Trends 2025: Sales, Prices, and Supply Analysis

December 19, 2025 by Marco Santarelli

housing market trends

In 2025, the housing market is showing a more balanced, albeit still watchful, picture. Existing-home sales saw a modest uptick in November 2025, driven by more favorable mortgage rates, but the overall supply of homes remains a key factor to watch for continued price appreciation.

It feels like just yesterday we were navigating the wild swings of the housing market, and I’ve been immersed in it for years, watching trends ebb and flow. What I'm seeing now, based on the latest reports from the National Association of REALTORS® (NAR), suggests a market settling into a more sustainable rhythm. The November 2025 data paints a nuanced story: sales are inching up, prices are holding steady with slight year-over-year gains, and inventory, while still tight, is showing signs of a slight increase compared to the previous year.

Housing Market Trends 2025: Sales, Prices, and Supply Analysis

A Closer Look at Sales in November 2025

The big news from NAR's November report is that existing-home sales increased by 0.5% compared to the previous month. This sounds small, but it's the third consecutive monthly rise, bringing the seasonally adjusted annual rate to 4.13 million units. This bump is directly linked to those lower mortgage rates we saw this past autumn. When borrowing becomes cheaper, more people start thinking about buying that new home.

Looking at the bigger picture, year-over-year, sales were down 1.0%. This tells me that while we're seeing improvement in the short term, the market is still reacting to the higher rates experienced earlier. It’s a bit of a tug-of-war between current affordability and past challenges.

Regionally, sales picked up in the Northeast and the South, stayed flat in the West, and dipped a bit in the Midwest. This pattern often reflects where job growth is strongest and where people are feeling more confident about putting down roots.

It’s fascinating to see how different housing types perform. According to the report, single-family homes continue to outperform condominiums. The median price for a condo is still significantly lower than for a single-family home, but we need to remember those ongoing condo association fees, which are climbing and can add a substantial chunk to the monthly housing cost.

Where Are Prices Heading?

This is the question on everyone's mind, isn't it? As of November 2025, the median existing-home price for all housing types stood at $409,200. This marks a 1.2% increase from the previous year. What’s really remarkable is that this is the 29th consecutive month of year-over-year price increases. It shows a persistent demand that keeps prices from falling, even with slightly slower sales activity.

  • Single-Family Homes: The median price for a single-family home also saw a 1.2% year-over-year increase, reaching $414,300.
  • Condominiums and Co-ops: These saw a more modest 0.1% increase year-over-year, with a median price of $358,600.

The West region saw a slight 0.9% decrease in median prices year-over-year, with the median price there at a still-high $618,900. This is an interesting counter-trend, and I'll be watching to see if this continues or if it's just a temporary blip in a generally upward trajectory across the country. Meanwhile, the Midwest saw a healthy 5.8% jump in median prices, likely benefiting from more affordable entry points.

The Crucial Factor: Housing Supply

This is where things get really interesting, and frankly, a bit concerning. While sales are improving, inventory is starting to feel the squeeze again. In November 2025, the total housing inventory was 1.43 million units. This is actually down 5.9% from October, meaning fewer homes were listed for sale in the final month of the year.

However, looking year-over-year, inventory is up 7.5% from November 2024. This is a positive sign, suggesting that more homeowners are starting to list their properties, which is essential for a healthy market. Still, we're looking at a 4.2-month supply of unsold inventory. Ideally, a balanced market has about 5-6 months of supply. So, while we're moving in the right direction, we're not quite there yet.

Lawrence Yun, NAR's Chief Economist, pointed out that “inventory growth is beginning to stall.” He also noted that with distressed property sales at historic lows and housing wealth at an all-time high, homeowners are quite comfortable staying put, especially during the winter months. This reluctance to sell is a significant contributor to the tight supply we're experiencing.

As a seasoned observer of the market, I can tell you that this lack of supply is the primary driver behind sustained price growth. When there are more buyers than homes, prices naturally get bid up. For 2025, addressing this supply issue is going to be paramount for achieving greater housing affordability and stability.

Who's Buying and How Are They Paying?

The NAR report also gives us insights into the buyers. The median time on market for properties in November 2025 was 36 days, up from 34 days the previous month and 32 days in November 2024. This slight increase in how long homes are sitting on the market suggests buyers have a little more breathing room and aren't facing the intense bidding wars of the recent past.

  • First-Time Homebuyers: They accounted for 30% of sales, which is unchanged from the previous year. While this is a steady number, it highlights the continuing challenge for new entrants to the market, especially with higher prices and competition.
  • Cash Sales: 27% of transactions were cash sales, up from 25% in November 2024. This indicates that investors or buyers with significant liquid assets are still a strong force.
  • Individual Investors/Second-Home Buyers: This group made up 18% of transactions, a notable increase from 13% in November 2024. This rise suggests that some investors see opportunities in the current market, likely anticipating future appreciation or rental income.
  • Distressed Sales: These remained at a historic low of 2%, confirming that foreclosures and short sales are not a significant market factor right now.

The Mortgage Rate Factor

Mortgage rates are closely tied to housing affordability and sales activity. In November 2025, the average 30-year fixed-rate mortgage was 6.24%. This is down from 6.25% in October and a noticeable drop from 6.81% a year ago. This moderation in rates is a welcome development and has undoubtedly contributed to the uptick in sales. For 2025, I believe continued stability or even further slight declines in mortgage rates will be a key catalyst for the housing market.

Looking Ahead to 2025: My Take

Based on this data and my own experience, here's what I foresee for the Housing Market Trends 2025:

  • Sales: I expect sales to continue their gradual upward trend. As more inventory comes on the market and mortgage rates remain relatively stable, more buyers will find their way back into the market. However, I don't anticipate a return to the frenzied pace of a couple of years ago. It will be a more deliberate and considered approach for most.
  • Prices: Price growth will likely moderate. While the upward trend will probably continue, the rapid appreciation we’ve seen might slow down. The balancing act between still-limited supply and improving affordability will keep prices moving, but perhaps at a more sustainable pace. We might see some regional variations, with hotter markets continuing to see stronger growth while more stagnant areas might experience flatlining or slight adjustments.
  • Supply: This remains the critical piece of the puzzle. While there are signs of improvement, the lack of affordable housing supply will continue to be a significant challenge throughout 2025. Efforts to boost new construction and encourage existing homeowners to sell will be crucial for the market's long-term health. I expect we'll see more policy discussions around incentivizing building and perhaps innovative solutions to bring more homes onto the market.

In essence, 2025 is shaping up to be a year of continued adjustment and stabilization for the housing market. It’s a market where thoughtful decision-making, backed by solid data and an understanding of the underlying forces, will be key for both buyers and sellers.

2026 Housing Market Forecast for Investors

Analysts project steady growth in select U.S. markets, with affordability shifts and rental demand shaping investor strategies in 2026.

Norada Real Estate helps investors leverage turnkey rental properties to capture cash flow and appreciation—positioning portfolios for strength in the year ahead.

🔥 HOT 2026 INVESTOR LISTINGS JUST ADDED! 🔥
Talk to a Norada investment counselor today (No Obligation):
(800) 611-3060

Get Started Now

Recommended Read:

  • Housing Market Predictions for 2025 by Bank of America
  • Housing Market Predictions for the Next 4 Years: 2025 to 2028
  • Housing Market Forecast for the Next 2 Years: 2024-2026
  • Housing Market Forecast Shows Affordability Crisis to Continue in 2025
  • Housing Market Predictions for Next Year: Prices to Rise by 4.4%
  • Real Estate Forecast Next 5 Years: Top 5 Predictions for Future
  • Is the Housing Market on the Brink: Crash or Boom?
  • Real Estate Forecast Next 10 Years: Will Prices Skyrocket?
  • Housing Market Predictions for Next 5 Years (2024-2028)

Filed Under: Housing Market, Real Estate Market Tagged With: Housing Market

Bay Area Housing Market Forecast for the Next 2 Years: 2026-2027

December 18, 2025 by Marco Santarelli

Bay Area Housing Market Forecast for the Next 2 Years: 2026-2027

If you're thinking about buying or selling a home in the Bay Area, or honestly, just curious about what's happening with one of the most talked-about real estate markets in the country, you've come to the right place. Let's dive into the Bay Area Housing Market Forecast.

The short answer? It looks like things are settling down. After some wild swings, the market seems to be finding a more stable footing, with modest price changes expected rather than a huge crash or another runaway boom in the immediate future. But as always with the Bay Area, there are layers to unpack.

Bay Area Housing Market Forecast for the Next 2 Years: 2026-2027

Key Takeaways

🏠 Current Average Home Value
$1,087,917 (Zillow)
in the Bay Area (November 2025)
⏱️ Median Days to Pending
21 Days
Time for pending sales
📉 2025 Bay Area Price Forecast
-1.6%
expected decline between November 2025 to November 2026
💹 Sales Dynamics
49.4%
of sales above listing price (October 2025)


Where the Bay Area Market Stands Today

Before we look ahead, let's get a feel for where the Bay Area housing market is today. Based on the latest data I'm seeing:

  • The average home value across the San Francisco-Oakland-Hayward area is sitting around $1,087,917.
  • That's actually down 3.2% compared to this time last year. It tells me things aren't just going up blindly anymore.
  • Homes are moving reasonably quickly, taking about 21 days on average to go into pending status. This is a decent pace, showing continued interest.
  • The median sale price recently clocked in at $1,105,333.
  • And the median list price (what sellers are asking) is currently $949,963.

This snapshot shows a market that's cooling off from the frenzy of previous years but still holds significant value and demand. Buyers might have a little more breathing room than before, but inventory and price points remain high.

A Look at the Forecast

Predicting the future is tough, but experts try their best! Zillow recently shared some insights into what they expect for the San Francisco area market. Here’s a breakdown of their predictions based on available data, looking at a few key dates:

Region Name Forecast Period Starts Forecast Dec 2025 Forecast Feb 2026 Forecast Nov 2026
San Francisco, CA (MSA) Nov 30, 2025 +0.2% -0.3% -1.6%

What does this mean?

  • December 2025: Zillow predicts a tiny increase of 0.2% in home values. This suggests a very slight upward tick, almost flat.
  • February 2026: By early 2026, the forecast shifts slightly negative, predicting a 0.3% drop. This indicates stabilization or a minor dip.
  • November 2026: Looking out a full year from late 2025, Zillow forecasts a larger decrease of -1.6%. This points towards a continued trend of modest price declines over the next year.

So, Zillow isn't predicting a crash, but they aren't forecasting a boom either. Their Bay Area housing market forecast suggests a period of slight depreciation or stabilization through much of 2026. Keep in mind this is for the broader metro area (MSA), which includes surrounding counties.

For context, let's look at nearby San Jose, another key part of the Bay Area:

  • December 2025: +0.6%
  • February 2026: -0.1%
  • November 2026: +0.8%

San Jose's numbers are a bit more mixed, showing a slightly stronger start but still settling into a more moderate range by the end of the forecast period. It's interesting how different parts of the Bay might behave slightly differently!

Bay Area vs. The Rest of the State of California

How does the Bay Area's outlook stack up against other major California cities? It's always helpful to compare. Here’s Zillow’s forecast for various regions in California:

Region Name Forecast Dec 2025 Forecast Feb 2026 Forecast Nov 2026
Los Angeles +0.2% +0.1% +1.2%
Riverside +0.1% +0.4% +2.2%
San Diego 0% -0.4% +1.6%
Sacramento 0% -0.3% -0.5%
San Jose +0.6% -0.1% +0.8%
Fresno +0.2% +0.4% +1.8%
Bakersfield +0.1% +0.3% +2.3%
Oxnard +0.2% 0% +0.9%
Stockton -0.2% -0.5% -0.7%
Modesto +0.1% +0.1% +0.8%
San Fran. +0.2% -0.3% -1.6%

Source: Zillow

From this, we can see a few things:

  • The San Francisco metro area has one of the most negative forecasts looking out to late 2026 among these regions.
  • San Jose shows a slightly more positive outlook by late 2026 than San Francisco.
  • Southern California markets like Los Angeles and San Diego are predicted to see modest growth by late 2026.
  • Inland areas like Bakersfield and Riverside show stronger positive growth predictions by the end of 2026.
  • Sacramento and Stockton are also showing slight declines in their longer-term forecasts, similar to San Francisco.

This comparison suggests the Bay Area, particularly San Francisco, might continue to experience a cooling trend relative to some other parts of California, while areas with potentially lower price points and different economic drivers might see more growth.

The Bigger Picture: National Housing Market Trends

What’s happening nationwide also influences our local Bay Area market. Both Zillow and the National Association of Realtors (NAR) have shared their thoughts on the U.S. housing market.

Zillow's National Predictions:

  • Home Values: Expect a modest rise of about 1.2% over the next 12 months. This is driven by ongoing inventory challenges, even with slightly softer demand.
  • Home Sales: They predict around 4.09 million existing home sales in 2025, a small increase from 2024. Things are expected to pick up more steam in 2026 as mortgage rates potentially ease.
  • Rents: Single-family rents are predicted to increase by 2.2%, partly because high mortgage rates are keeping more people renting. Apartment rents might dip slightly.

NAR Chief Economist Lawrence Yun's Outlook:

  • Existing Home Sales: Yun is more optimistic, forecasting a 6% increase in 2025 and an 11% jump in 2026. He sees a real recovery coming.
  • New Home Sales: Projected to grow by 10% in 2025 and another 5% in 2026, which is great news for tackling housing shortages.
  • Median Home Prices: Modest growth is expected, around 3% in 2025 and 4% in 2026. This is a return to more sustainable appreciation.
  • Mortgage Rates: Yun sees rates averaging 6.4% in late 2025 and dropping to 6.1% in 2026. He calls lower rates a “magic bullet” for affordability.

My Take on National Trends: The national picture suggests a market moving towards stabilization and modest growth, heavily influenced by mortgage rates. If rates come down as predicted, it could unlock demand nationwide. However, the Bay Area often dances to its own beat due to its unique economic factors and extremely high costs.

So, Will Bay Area Home Prices Drop Significantly? Will it Crash?

This is the million-dollar question, right? Based on everything I'm seeing – the current slight year-over-year dip, Zillow's forecast showing declines through late 2026 for SF, and the national trends pointing towards stabilization – I don't think we're looking at a “crash” in the way some might fear.

A crash usually means a steep, rapid drop in prices across the board, often tied to major economic downturns or market imbalances. While the Bay Area is seeing some price softening, especially compared to the peaks, several factors are likely preventing a nosedive:

  1. Persistent Housing Shortage: We've built far fewer homes than needed for decades. This fundamental supply issue provides a floor for prices. Even with slower demand, there simply aren't enough homes for everyone who wants one.
  2. Strong Job Market (Relatively): Despite tech layoffs, the Bay Area remains a hub for innovation and attracts talent. A healthy (even if evolving) job market supports housing demand.
  3. Interest Rate Sensitivity: The current high mortgage rates are impacting affordability and cooling demand, which explains the price moderation. If rates ease significantly as NAR predicts, it could actually boost prices by bringing more buyers back into the market.
  4. Inventory Levels: While improving slightly, inventory isn't overflowing. Homes are still selling within a reasonable time frame. A market crash typically involves a huge glut of homes sitting on the market.

My assessment? Expect continued moderation. Prices might nudge down slightly more in some areas, particularly for properties that were overpriced during the boom. Sellers might need to be more realistic with their pricing and expectations. However, a widespread, dramatic price collapse seems unlikely given the underlying supply constraints and the region's economic importance. Think stabilization and perhaps minor corrections, not a crash.

A Peek into Late 2026 and Early 2027

Looking further out is even more speculative, but we can try to connect the dots.

If mortgage rates do ease towards the 6-6.5% range by mid-to-late 2026, as NAR suggests, this could stimulate demand. Combined with the ongoing (though slow) improvement in housing inventory, we might see:

  • Increased Sales Activity: More buyers could enter the market, leading to higher transaction volumes.
  • Slight Price Rebound: Depending on how much demand returns versus available supply, prices could start to tick up again modestly towards the end of 2026 and into early 2027. The Zillow forecast shows a slight uptick for San Jose by Nov 2026, which might be an early sign of this.
  • Continued Regional Differences: High-cost areas like San Francisco might still lag behind more affordable regions in terms of price growth.

However, if economic conditions worsen or interest rates stay stubbornly high, the slight price declines forecast by Zillow for the Bay Area could persist longer into 2027. The key factors to watch will be inflation, Federal Reserve policy on interest rates, and the overall health of the tech sector and wider economy.

Wrapping Up: Navigating the Bay Area Market

The Bay Area housing market forecast paints a picture of transition. We're moving away from the rapid appreciation of recent years towards a more balanced, albeit still expensive, market. Expect moderate price adjustments rather than drastic drops. For buyers, this might mean slightly better opportunities and perhaps less competition, especially if they can secure a decent mortgage rate. For sellers, patience and realistic pricing will be key.

It’s a complex market, and while data gives us guideposts, real estate always involves unique local factors. Staying informed and working with knowledgeable professionals is the best way to navigate whatever comes next.

Want Stronger Returns? Invest Where the Housing Market’s Growing

Turnkey rental properties in fast-growing housing markets offer a powerful way to generate passive income with minimal hassle.

Work with Norada Real Estate to find stable, cash-flowing markets beyond the bubble zones—so you can build wealth without the risks of ultra-competitive areas.

🔥 HOT NEW LISTINGS JUST ADDED! 🔥

Talk to a Norada investment counselor today (No Obligation):

(800) 611-3060

Get Started Now

Also Read:

  • Bay Area Housing Market Predictions 2030
  • Bay Area Housing Market: What Can You Buy for Half a Million?
  • Bay Area Home Prices Skyrocket: Wealthy Buyers Fuel Market
  • Bay Area Housing Market: Prices, Trends, Forecast
  • Bay Area Housing Market Booming! Median Prices Hit Record Highs
  • Most Expensive Housing Markets in California
  • SF Bay Area Housing Market Records 19% Sales Growth
  • Bay Area Housing Market Heats Up: Home Prices Soar 11.9%

Filed Under: Housing Market, Real Estate Market Tagged With: Bay Area, california, Home Price Forecast, Home Price Trends, Housing Market, Housing Market Forecast, housing market predictions

Austin vs. Raleigh: Which Tech Hub Has the Stronger Housing Market for Investors?

December 18, 2025 by Marco Santarelli

Austin vs. Raleigh: Which Tech Hub Has the Stronger Housing Market for Investors?

For years, investors chasing tech money have looked at two Sun Belt superstars: Austin, Texas, and Raleigh, North Carolina. Both cities have rocketed up the rankings for population growth, job creation, and overall “cool factor.” But if you’re putting your hard-earned capital into property, you need to know which city gives you the better investment.

Austin vs. Raleigh: Which Tech Hub Has the Stronger Housing Market for Investors?

We aren't looking for the better place to live—we are looking for the strongest financial returns. So, let’s answer the million-dollar question right upfront: Austin vs. Raleigh: Which Tech Hub Offers Stronger Real Estate Returns?

The short answer, based on current affordability and market maturity, is that Raleigh, NC, currently offers a more sustainable and less volatile path to long-term returns, while Austin, TX, remains the higher-risk, higher-reward play that requires far more precise timing.

I’ve been tracking the incredible shifts in these competitive markets for over a decade, and what I’ve seen recently suggests that the rules have changed. Austin’s massive run-up has created hurdles, while Raleigh’s measured, diversified growth keeps making it an investor darling. Let’s dive deep into the specific dynamics that make these two cities fundamentally different when it comes to stacking up profit.

The Tale of Two Texas Towns (and the Other One in NC)

When we look at both metros, we are analyzing two distinct styles of economic development. Austin is the flashy newcomer; Raleigh is the quiet anchor.

Feature Austin, TX (The Rocket) Raleigh, NC (The Anchor)
Primary Growth Driver Corporate relocations (Tesla, Samsung, Oracle), Venture Capital (VC) funding. Research Triangle Park (RTP), Universities (UNC, Duke, NC State), Biotech/Pharma.
Market Maturity Highly mature, high prices, rapidly compressed yields. Maturing rapidly, but still maintains a significant affordability gap advantage over Austin.
Population Growth Rate Explosive (Historically among the fastest in the US). Very strong and steady.
State Tax Structure No state income tax. High property taxes. State income tax. Lower property taxes (generally).
Investment Profile Appreciation heavy (Capital Gains). Balanced (Appreciation + Cash Flow potential).

The Beast Under the Bridge: The Austin Model

When I think about investing in Austin, I think about momentum. For a long time, Austin couldn't lose. The city became the premier destination for tech workers fleeing California, driving prices up at an absolutely staggering rate.

The Volatility Factor

In real estate, growth often comes with a bill, and for Austin, that bill is volatility. We saw median prices soar by 40% in a single year during the peak pandemic boom. This level of rapid appreciation is thrilling, but it dramatically increases the risk of market correction—which is exactly what we saw when interest rates climbed.

My personal analysis of Austin's growth trajectory is that it mirrors markets that rely heavily on a constant injection of VC money and “big fish” corporate moves. When the tech sector hiccups or national interest rates rise, the brakes slam harder here than almost anywhere else.

The Property Tax Headache

One major fundamental difference that impacts long-term investment returns in Austin is the property tax situation. Texas prides itself on having no state income tax, but they make up for it aggressively at the local level.

If you are a buy-and-hold investor aiming for cash flow, those constantly rising property valuations mean your tax burden rises annually, often eating away at your net operating income (NOI). In markets like Dallas or Houston, you have higher rent-to-value ratios to absorb this, but in prime Austin, yield compression is severe. Many investors are simply betting on massive appreciation, effectively turning their rental property into an asset where the income is just enough to cover the massive operating costs. That is a dangerous, appreciation-only strategy.

The Steady Hand: The Raleigh/Research Triangle Model

Now let’s look east to Raleigh, the anchor of the Research Triangle Park (RTP), which includes Durham and Chapel Hill. Raleigh is not a new contender, but it didn't get the same blinding media spotlight as Austin, and that’s a good thing for investors.

The Power of Diversification

The key to Raleigh’s resilience is its foundation. Where Austin relies heavily on IT and venture-backed startups, Raleigh’s economy is built upon three pillars:

  1. Academia: The triangle is anchored by three major research universities (UNC, Duke, NC State) that generate a constant, highly educated talent pipeline.
  2. Government: As the state capital, Raleigh has a stable base of state and federal jobs that act as a buffer during recessions.
  3. Biotech and Pharma: The RTP is one of the world's leading centers for life sciences. These companies—think major, stable employers like Pfizer and Merck—are less susceptible to the immediate cyclical downturns that plague the pure tech sector.

When the 2022 market slowdown hit, Raleigh felt the cooling effects, but its descent was far more gentle and controlled than Austin’s sharp drop. Why? Because the job market didn't panic. The pharmaceutical companies still needed scientists, and the universities still needed staff. This translates directly into more stable housing demand.

The Affordability Advantage for Investors

This is the big one. Even after years of growth, Raleigh remains significantly more affordable than Austin, particularly when you look at median home price versus median rent.

In my professional opinion, the stronger the rent-to-value ratio, the stronger the long-term investment.

While Austin’s median prices pushed into the mid-six figures long ago, Raleigh has maintained better entry points. This means:

  • Lower initial capital outlay.
  • Better potential for positive cash flow from day one (or at least much sooner).
  • A wider tenant pool, as housing remains accessible to mid-level income earners, not just highly paid tech execs.

The Critical Factors: Where Investors Need to Look Beyond Price

To truly decide which market offers stronger returns, we have to look past the superficial trends and examine the regulatory and construction environment. This is where real expertise comes in.

1. The Inventory Battle (Permitting and Supply)

When a city has incredible demand, the smart response is to build, build, build. But Austin has had a massive supply problem, worsened by local permitting delays that made it difficult for housing supply to catch up with demand. Developers, driven by high prices, eventually rushed in.

Expert Insight: Austin has experienced a significant surge in multi-family and single-family permitting. While this is necessary, rapid, large-scale supply hitting the market during a slowdown leads to oversupply issues and potential pressure on rental rates. It’s a boom-and-bust cycle.

Raleigh, while also experiencing a construction boom, has maintained a more balanced development pace. This slower pace, while sometimes frustrating for renters, is beneficial for property owners because it prevents catastrophic supply gluts that kill rental price growth.

2. Taxation and Regulation: The State Matters

A common mistake new investors make is ignoring the regulatory differences between states.

Factor Texas (Austin) North Carolina (Raleigh) Impact on Returns
Income Tax 0% State Income Tax Progressive State Income Tax TX sounds better, but NC's slightly higher state taxes often fund better infrastructure, lowering city operational costs.
Property Tax High Rates (Often 2%+) Moderate Rates (Generally below 1.2%) NC wins here for cash flow investors. Lower annual operating expenses directly boost NOI.
Landlord/Tenant Law Generally Landlord-friendly Moderate, Moving toward balance Both states are relatively fair, but local ordinances (like short-term rental rules) must be watched closely.

My opinion is clear: for the long-term rental investor prioritizing cash flow stability, North Carolina’s lower property tax burden provides a foundational competitive advantage over Austin’s structure.

3. Demographic Flow and Wage Divergence

Both cities attract highly skilled workers, but Raleigh is becoming increasingly attractive to companies due to wage arbitrage. Tech companies realize they can hire excellent engineers in Raleigh for 15-20% less than they would pay in Austin (or 30-40% less than in Silicon Valley). This allows businesses to expand aggressively without crippling payroll costs, ensuring the job machine keeps churning out new residents needing housing. This constant, slightly less expensive talent flow creates a highly stable rental demand base.

The Rubber Meets the Road: A Cash Flow Comparison

To make this tangible, let’s run a simple side-by-side calculation focusing on the cost of ownership, assuming two similar properties purchased as rentals in desirable sub-markets of each metro area. This example highlights the massive impact of property taxes on your Net Operating Income (NOI).

We will focus purely on the property tax and price differences, which are the main differentiators in annual cash flow for buy-and-hold investors.

Investment Metric Austin, TX (Approximate) Raleigh, NC (Approximate) Key Result for Investors
Purchase Price $550,000 $425,000 Raleigh requires $125k less capital.
Estimated Rent $2,800 / month $2,400 / month Austin rent is higher, but so is the price.
Effective Property Tax Rate 2.1% 1.1% This is the crucial difference.
Annual Property Tax Burden $11,550 $4,675 The silent killer of cash flow in Austin.
Annual Tax Difference N/A Saves $6,875 Raleigh investor pockets nearly $7k more annually before factoring in mortgage.
Monthly Tax Cost $962.50 $389.58 The Raleigh tax is nearly $600/month less.

Note: These figures are approximations used for comparative illustration and do not include mortgage, insurance, or maintenance costs.

What this calculation tells me, as an expert investor, is critical: Even though the Austin property rents for $400 more per month, the Raleigh investor’s annual property tax savings ($6,875) virtually wipes out that rental premium. The Raleigh property starts off with a vastly superior operational cost structure, making positive cash flow much easier to achieve and maintain, especially in the first few years.

The Rental Income Reality Check

The strongest returns are not just about sale price appreciation; they are about the total return—combining cash flow (rental income) and appreciation.

Austin's Compressed Yields

Due to the aggressive price increase, Austin’s cap rates (the ratio of Net Operating Income to property value) have plummeted. If you buy an expensive property but your rent barely covers the mortgage, insurance, and those heavy Texas property taxes, your yield is compressed, maybe even negative. You are effectively betting your entire return on the hope that someone will buy the property for even more money in five years.

Raleigh’s Cash Flow Potential

While Raleigh’s cap rates have also tightened, they are generally healthier than Austin’s, especially in secondary markets around RTP like Cary, Apex, or Durham. An investor in Raleigh has a much higher likelihood of achieving a small but reliable positive cash flow, providing a critical safety net against market dips.

I always advise investors to look for markets where you can be right two ways: through appreciation AND through cash flow. Raleigh provides a better opportunity to execute this dual strategy.

Investment Strategies for Each Market

Because these cities operate on different risk levels, your strategy needs to adapt:

Austin Strategy (High-Risk/High-Reward)

  • Target: Highly specialized niche properties (e.g., luxury rentals near Tesla Giga Factory, short-term rentals near downtown).
  • Focus: Capital preservation and appreciation, not immediate cash flow.
  • Best Play: Land speculation and new development in rapidly expanding submarkets (e.g., Leander, Georgetown) before they fully mature. Requires deep pockets and high risk tolerance.
  • Keywords to Track: Austin luxury housing supply, Central Texas commercial permitting, VC funding rounds.

Raleigh Strategy (Sustainable Growth)

  • Target: Single-family homes in established commuter corridors (e.g., close to I-40 access points) or townhomes near university campuses.
  • Focus: Balanced strategy—steady appreciation supplemented by reliable cash flow.
  • Best Play: Buying properties that appeal to the stable, highly educated workforce employed by RTP. This is the ultimate defensive position for real estate investing.
  • Keywords to Track: Raleigh-Durham biotech job growth, Wake County property tax rates, RTP employee headcount.

My Final Verdict on Returns

When comparing Austin vs. Raleigh: Which Tech Hub Offers Stronger Real Estate Returns, we must recognize that “stronger” doesn't just mean “highest peak.” It means the most consistent, resilient, and repeatable return profile.

Austin is like buying volatile tech stock; the gains can be huge, but the drops are sharp, and your entry point has to be perfect. Raleigh is like a blue-chip stock—steady, reliable, paying a decent dividend (cash flow) while slowly and surely increasing in value.

For the investor who values predictable cash flow, lower operating expenses, and resilient demand driven by diversified institutional anchors, Raleigh, NC, provides the stronger, more secure foundation for long-term real estate returns. Austin still has momentum, but its affordability crisis and tax structure mean the margin for error is razor-thin. Raleigh wins on fundamentals.

The Ultimate Guide to Passive Real Estate Investing

Download Your FREE Guide to Passive Real Estate Wealth

Real estate investing has created more millionaires than any other path—and this guide shows you how to start or scale with turnkey rental properties.

Inside, you’ll learn how to analyze cash flow and returns, choose the best markets, and secure income-generating deals—perfect for building long-term wealth with minimal hassle.

🔥 FREE DOWNLOAD AVAILABLE NOW! 🔥

Download

Want Stronger Returns? Invest Where the Housing Market’s Growing

Turnkey rental properties in fast-growing housing markets offer a powerful way to generate passive income with minimal hassle.

Work with Norada Real Estate to find stable, cash-flowing markets beyond the bubble zones—so you can build wealth without the risks of ultra-competitive areas.

🔥 HOT NEW LISTINGS JUST ADDED! 🔥

Talk to a Norada investment counselor today (No Obligation):

(800) 611-3060

Get Started Now

Recommended Read:

  • Dallas vs. Houston: Which City Offers Better Returns for Real Estate Investors
  • Single-Family vs. Townhome: Which is the Real Cash Flow Winner for Investors?
  • 5 Hottest Florida and Texas Markets for Real Estate Investors in 2025
  • Best Places to Invest in Real Estate: November 2024 Hotspots
  • How to Secure Your Retirement With Cash-Flowing Rental Properties
  • Best Places to Invest in Single-Family Rental Properties in 2025
  • 5 Hottest Real Estate Markets for Buyers & Investors in 2025

Filed Under: Housing Market, Real Estate, Real Estate Investing Tagged With: Austin, Housing Market, Raleigh, Real Estate Investing

Florida Housing Market Forecast 2026: Another Year of Price Correction

December 17, 2025 by Marco Santarelli

Florida Housing Market: Home Price Forecast for 2026

The Florida housing market forecast points to a continued cooling in home prices in 2026, following several years where the Sunshine State's market has taken a different path than the rest of the country. According to the latest projections from Realtor.com®, we can expect a slight average dip in home prices across Florida's eight largest metro areas. While this might sound unnerving, it’s crucial to understand the nuances behind these numbers to make informed decisions.

As someone who has been following Florida's real estate trends closely, I’ve seen firsthand how dynamic and sometimes unpredictable this market can be. While national headlines might paint a broad picture, Florida often has its own unique story. This year, that story involves a shift from the feverish pace of recent years to a more balanced, and in some areas, declining price environment. However, this doesn't mean the dream of homeownership in Florida is out of reach; it simply means a more opportune time might be on the horizon for many buyers.

Florida Housing Market Forecast 2026: Another Year of Price Correction

Understanding the Trends: Why Florida is Different

For a while, Florida seemed to be on a rocket ship, with home prices soaring. But as Realtor.com® senior economist Joel Berner points out, “Florida has had a very different story than the national market over the past several years and a much different outlook.” The primary driver for this divergence seems to be a growing supply of homes hitting the market at a time when demand has softened somewhat.

I've noticed this myself when looking at inventory levels. We've seen a significant amount of new construction, which is fantastic for housing availability, but when combined with shifts in buyer behavior, it naturally leads to a recalibration of prices.

Metro-Level Projections: Where the Biggest Changes Might Happen

The Realtor.com® forecast offers a fascinating look at how different parts of Florida are expected to fare:

  • Average Decline: Across the eight largest metro areas, a projected average decrease of 1.9% in median sales prices for existing homes and condos is anticipated for 2026. This is notably lower than the expected national gain of 2.2%.
  • Miami: A Lone Star? Interestingly, Miami is the only one of these major markets projected to see a positive gain, with an estimated growth of 1.1%. This suggests a continued strong pull for properties in South Florida, perhaps driven by international buyers or a sustained demand for its lifestyle.
  • Gulf Coast Hit Hardest: The Gulf Coast regions are expected to experience the most significant price adjustments. Cape Coral faces a projected decline of 10.2%, followed by North Port at 8.9%, and Tampa at 3.6%. These areas saw substantial price increases previously, and a correction is not entirely unexpected.
  • Other Major Cities: Jacksonville (-1.4%), Orlando (-1.6%), and Palm Bay (-1%) are also anticipated to see modest price declines. Lakeland is projected to have a very small decrease of -0.2%.

The Condo Conundrum: A Major Influence on Prices

When I delve into the data, one thing becomes crystal clear: condos are playing a significant role in the overall price trends in Florida. Realtor.com® data shows that the weakness in the condo market is the main reason for the statewide price softness.

  • Condo Prices Down Sharply: In the first half of 2025, median listing prices for condos were down a significant 10.8% compared to the same period in 2023. For comparison, single-family home prices saw a smaller decline of 3.6% over the same timeframe.
  • Special Assessments and HOA Fees: A major factor impacting condo demand and prices appears to be the rising auxiliary costs of homeownership. Soaring insurance premiums and steep homeowners association (HOA) fees, especially for condos, have become a significant burden. Recent regulatory changes may have also led to an uptick in HOA special assessment fees, which can substantially impact a buyer's monthly expenses and the overall appeal of a condo.

Beyond Price Tags: The Cost of Ownership Matters

It’s not just the sticker price of a home that influences the market. As I mentioned, insurance costs and HOA fees are major concerns for Floridians. I know many homeowners who are feeling the pinch, and this directly affects how much they can afford or are willing to pay for a property.

Governor Ron DeSantis has even pushed for measures like the elimination of property taxes on owner-occupied homes as a potential solution to these rising costs. While such a move could theoretically boost home values, it requires significant political and voter backing, making its immediate impact uncertain.

Factors Shaping Demand and Supply

Several forces are at play in shaping Florida’s housing dynamics:

  • New Construction: The state has seen a high rate of new home building. While this increases the supply of homes, it can also lead to increased competition among builders and potentially put downward pressure on prices if demand doesn't keep pace.
  • Remote Work Slowdown: The surge in remote work during the pandemic fueled demand in places like Florida's “Sun Belt.” As more companies call employees back to the office, this demand driver may be waning, affecting the market.
  • Mortgage Rates: While high interest rates have been a deterrent, any relief on this front could stimulate demand by making it easier for renters to transition into homeownership. This could especially help first-time homebuyers.
  • Builder Response: In response to price cues and market conditions, builders are likely to slow down new construction. This proactive measure can help prevent a severe imbalance between supply and demand in the future.

Affordability: A Mixed Picture

Despite recent price dips, the overall affordability of single-family homes in Florida remains a concern.

  • Single-Family Homes: Even with price declines, the typical single-family home in Florida is listed at about six times the state's median household income for 2025. This is higher than the pre-pandemic average ratio of 5.6 times.
  • Condos: On the other hand, condos have become relatively more affordable. The ratio of condo listing prices to median income is projected to fall to about 4.4 in 2025, down from a pre-pandemic average of 4.6. This suggests that, based purely on listing price, condos are now a more attractive option than before COVID-19.

However, and this is a big caveat I always emphasize, the increased costs of insurance and HOA fees can significantly offset these affordability gains for condos. For buyers, it's crucial to look beyond the asking price and understand the total cost of ownership.

What This Means for You

For potential buyers, this Florida housing market forecast suggests a potential shift in power from sellers to buyers. In areas expecting price declines, there might be more room for negotiation. It could present a more opportune moment to enter the market, especially if you're looking for a single-family home and can absorb the associated ownership costs. For condo buyers, careful due diligence on insurance and HOA fee trends is paramount.

For sellers, the advice is to be realistic about pricing, especially in markets projected for declines. Understanding the local conditions and the specific type of property you're selling is key.

The Florida market is perpetually fascinating. While the forecast indicates a cooling period, it’s not a universal downturn. Miami's resilience and the ongoing affordability improvements in the condo market (when considering listing price alone) show the complexity. As always, staying informed with reliable data from sources like Realtor.com® and consulting with local real estate professionals is the best approach to navigating these evolving trends.

Florida’s Market Is Shifting—Investors Are Staying Ahead

From Cape Coral to Jacksonville, Florida’s housing market is evolving—but turnkey investors are locking in cash-flowing properties while prices and rents remain favorable.

Norada Real Estate helps you navigate Florida’s changing landscape with fully managed rental properties in high-demand cities—so you can build passive income and long-term equity with confidence.

🔥 NEW FLORIDA LISTINGS JUST ADDED! 🔥

Talk to a Norada investment counselor today (No Obligation):

(800) 611-3060

Get Started Now

Want to Know More About the Florida Housing Market?

Explore these related articles for even more insights:

  • Multiple Florida Housing Markets Are on the Brink of a Crash in 2026
  • Florida Condos Hit Hardest Since the Great Recession as Prices Tumble
  • Florida Leads Among the Fastest Cooling Housing Markets of 2025
  • Florida Housing Market Predictions Over the Next One Year
  • Florida Housing Market Trends: 4 Cities Turn Buyer-Friendly in 2025
  • Florida Housing Market Sees a Major Shift With a Jump in Pending Sales
  • Florida Housing Prices Drop for the Fifth Consecutive Month in 2025
  • Is the Florida Housing Market on the Edge of a Crash or Downturn?
  • 24 Florida Housing Markets Could See Home Prices Drop by Early 2026
  • Tax Relief Proposed as Florida Housing Market Faces Deepening Crisis
  • Florida Housing Market: Record Supply Expected to Favor Buyers in 2025
  • Florida Housing Market Forecast for Next 2 Years: 2025-2026
  • Florida Housing Market: Predictions for Next 5 Years (2025-2030)

Filed Under: Housing Market, Real Estate Market Tagged With: Florida, Florida Condos, Housing Market

Multiple Florida Housing Markets Are on the Brink of a Crash in 2026

December 17, 2025 by Marco Santarelli

Multiple Florida Housing Markets Are on the Brink of a Crash in 2026

The question on everyone’s mind is: Will Florida’s housing market crash in 2026? Based on the latest insights from Cotality, five Florida housing markets are being closely watched for a potential significant dip in home prices. While a full-blown “crash” might be too strong a word for what I see happening, these areas are definitely experiencing a notable correction. Let me break down what this means for you, whether you're looking to buy, sell, or just curious about the Sunshine State's real estate scene.

Multiple Florida Housing Markets Are on the Brink of a Crash in 2026

Markets on the Radar: The Top 5 Florida Cities to Watch

Cotality has identified a list of markets with a very high risk of price decline within the top 100 largest metro areas in the U.S. Among these, five are nestled right here in Florida. These aren't just random picks; they are based on specific data that signals a cooling trend.

Here’s the list, according to Cotality’s analysis:

  1. Cape Coral, FL
  2. Fort Lauderdale, FL
  3. Lakeland, FL
  4. Palm Bay, FL
  5. West Palm Beach, FL

It's important to understand that “risk of price decline” doesn't automatically mean a catastrophic collapse. Instead, it suggests a period of adjustment where prices might see a significant pullback from their recent peaks. As a real estate professional who has navigated various market cycles, I can tell you that corrections are natural, especially after periods of rapid growth.

Why These Florida Markets? Unpacking the Trends

You might be wondering, what makes these particular cities stand out? The data paints a picture of markets that experienced significant growth during the pandemic-fueled boom and are now seeing a recalibration. Realtor.com's analysis, combined with insights from experts like Cara Ameer, a real estate broker at Coldwell Banker Vanguard Realty in Florida, and Karen Borrelli, president of Royal Palm Coast Realtor Association, helps us understand the driving forces.

The “Cooling” Trend: Florida Dominates the List

It's not just these five cities. In fact, the same report shows that seven of the top 10 coolest housing markets in the U.S. are in Florida. This “coolest” designation refers to markets experiencing the steepest home price declines.

Here are some of the cities mentioned in that report:

  • Cape Coral, FL (-7.1% year-over-year price decline)
  • Naples, FL (-6.7%)
  • Punta Gorda, FL (-6.2%)
  • Sebring, FL (-5.2%)
  • North Port, FL (-5.1%)
  • Brownsville, FL (-4.8%)
  • Sebastian, FL (-4.6%)

This widespread cooling across Florida suggests broader economic and demographic shifts at play, rather than isolated issues.

Cape Coral: A Case Study in Market Correction

Cape Coral, a city known for its extensive canal system, has been particularly highlighted. Its home prices have fallen significantly. According to Realtor.com's analysis of the latest data, the typical single-family home in Cape Coral sold for nearly 7% less in August 2025 compared to the previous year. Even more striking, compared to the pandemic boom era of August 2022, the median home sales price has dropped by over 13%. North Port has seen an even more dramatic long-term correction, with typical August 2025 home sales prices 20% less than three years prior.

What’s impacting Cape Coral?

  • Rising Costs: Higher interest rates, increasing insurance premiums, and climbing foreclosure rates are dampening buyer enthusiasm.
  • Insurance Woes: Being on the Gulf Coast makes cities like Cape Coral vulnerable to hurricanes and flooding. This leads to higher and harder-to-get homeowner's insurance. Cape Coral has the third-highest premium-to-market ratio in the nation at 2.2% – meaning a $350,000 home could cost $7,700 annually in insurance alone.
  • Foreclosures: ATTOM data from Q3 2025 showed Cape Coral having one of the highest foreclosure rates among major metros. While this number is up, local real estate professionals like Karen Borrelli caution against jumping to conclusions about a full-blown crisis.

Beyond Cape Coral: Common Themes

The challenges faced by Cape Coral – like rising insurance costs and the aftermath of a red-hot market – are not unique. Many coastal Florida markets are experiencing what experts call an overcorrection.

Cara Ameer points out that while Florida doesn't have state income tax, the savings are often overwhelmed by the rising costs of homeownership in these desirable but vulnerable areas, coupled with higher HOA and condo fees. This can make Florida feel “lopsided” in terms of property values.

The “Too High, Too Fast” Phenomenon

The general consensus from experts is that the pandemic market went up too high, too fast. This made homes unaffordable for many, leading to weakened demand and a necessary price correction. As Hannah Jones, senior economic research analyst at Realtor.com, puts it, this rebalancing is likely to continue until demand picks up enough to stabilize prices.

Is a “Crash” Imminent or a “Correction” Expected? My Take

As someone who lives and breathes real estate, I believe the term “crash” is often used to generate clicks and alarm. What we are more likely seeing is a market correction. Think of it like a stretched rubber band snapping back – not breaking, but returning to a more natural state.

The data from Cotality is valuable because it identifies areas showing the highest risk of price declines. This allows buyers to potentially find better deals and sellers to adjust their expectations.

Karen Borrelli’s perspective is crucial here: the cooling is primarily seen in pricing, not necessarily in the volume of sales. Buyers are still active, but they are shopping for better value. This means sellers who had unrealistic price expectations based on the pandemic frenzy might need to lower them to attract buyers. As Borrelli notes, it might actually be a really good time to buy in these markets if you find a property priced realistically.

What Does This Mean for the Future?

The outlook for these five Florida housing markets in 2026 isn't necessarily doomsday. Instead, it points to a market that is becoming more balanced and, frankly, healthier.

  • For Buyers: This could be an opportunity. With prices adjusting and some sellers becoming more motivated, you might be able to negotiate better terms. However, always factor in the rising costs of insurance and potential HOA fees, especially in coastal areas.
  • For Sellers: It's time to be realistic. Holding onto outdated pricing from 2021 or 2022 will likely result in your property sitting on the market. Pricing your home competitively based on current conditions and market comparable sales is key. Offering concessions can also help attract buyers. Some sellers, particularly in areas like Miami, have chosen to delist and wait for market conditions to improve.
  • For Investors: These markets might present opportunities for long-term investors looking for properties that will appreciate gradually rather than rapidly. It’s about finding value and understanding the local economic drivers beyond just tourism.

Looking Ahead: Stabilizing Prices vs. a Steep Decline

The critical question is whether these markets will stabilize or continue a steeper decline toward 2026. Based on the expert opinions and the data, the trend seems to be towards stabilization as prices rebalance.

  • Fundamentals Still Strong: In many Florida markets, the underlying fundamentals remain strong. People are attracted to the lifestyle, climate, and, for some, the lack of state income tax.
  • Demand Re-emerging: As prices become more affordable due to the correction, demand is likely to pick up again, creating a more stable environment. Borrelli believes we are approaching a point where the value proposition for houses in these areas is becoming clear, which should lead to steadier prices.

In conclusion, while a dramatic “crash” that wipes out home values across the board is unlikely, these five Florida housing markets – Cape Coral, Fort Lauderdale, Lakeland, Palm Bay, and West Palm Beach – are indeed in a period of significant price correction. This isn't necessarily a bad thing, as it can lead to a more sustainable and balanced market. For those involved in real estate, understanding these trends and expert insights is crucial for making informed decisions in the coming years.

Florida’s Market Is Shifting—Investors Are Staying Ahead

From Cape Coral to Jacksonville, Florida’s housing market is evolving—but turnkey investors are locking in cash-flowing properties while prices and rents remain favorable.

Norada Real Estate helps you navigate Florida’s changing landscape with fully managed rental properties in high-demand cities—so you can build passive income and long-term equity with confidence.

🔥 NEW FLORIDA LISTINGS JUST ADDED! 🔥

Talk to a Norada investment counselor today (No Obligation):

(800) 611-3060

Get Started Now

Want to Know More About the Florida Housing Market?

Explore these related articles for even more insights:

  • Florida Condos Hit Hardest Since the Great Recession as Prices Tumble
  • Florida Leads Among the Fastest Cooling Housing Markets of 2025
  • Florida Housing Market Predictions Over the Next One Year
  • Florida Housing Market Trends: 4 Cities Turn Buyer-Friendly in 2025
  • Florida Housing Market Sees a Major Shift With a Jump in Pending Sales
  • Florida Housing Prices Drop for the Fifth Consecutive Month in 2025
  • Is the Florida Housing Market on the Edge of a Crash or Downturn?
  • 24 Florida Housing Markets Could See Home Prices Drop by Early 2026
  • Tax Relief Proposed as Florida Housing Market Faces Deepening Crisis
  • Florida Housing Market: Record Supply Expected to Favor Buyers in 2025
  • Florida Housing Market Forecast for Next 2 Years: 2025-2026
  • Florida Housing Market: Predictions for Next 5 Years (2025-2030)

Filed Under: Housing Market, Real Estate Market Tagged With: Florida, Florida Condos, Housing Market

10 Housing Markets Predicted to See Rapid Price Decline in 2026

December 17, 2025 by Marco Santarelli

10 Housing Markets Predicted to See Rapid Price Decline in 2026

If you've been watching the housing market with a bit of worry, wondering when things might become more manageable for buyers, I have some good news. Based on the latest 2026 National Housing Forecast from Realtor.com®, several housing markets are expected to see their home price growth slow down considerably – or even dip – by 2026. This presents a significant opportunity for those looking to purchase a home.

10 Housing Markets Predicted to See Rapid Price Decline in 2026

For most of us, housing is the biggest purchase we'll ever make. It’s not just about a roof over our heads; it’s about building equity, creating a stable environment, and making an investment in our future. The wild ride of the past few years, with prices soaring at breakneck speed, has made that dream feel out of reach for many. But as we look ahead to 2026, a shift is on the horizon.

Nationally, Realtor.com® predicts a modest price increase of 2.2% year-over-year. While this is still growth, it’s a far cry from the double-digit leaps we’ve become accustomed to. What’s even more interesting is that this national picture masks some dramatic regional differences. In fact, nearly a quarter of the top 100 housing markets are expected to see actual price declines in 2026. This is where the real story lies for potential homebuyers.

Where the Price Slowdown is Hitting Hardest

It's not just a little cooling; some areas are looking at a significant shift. According to Realtor.com®'s forecast, the metros expected to experience the steepest drops in home price growth are largely clustered in coastal states. Florida takes a commanding lead with four metros in the top 10, while California follows with three. We're also seeing projections for softening prices in Raleigh, North Carolina, Spokane, Washington, and Denver, Colorado.

The Top Metros to See Price Growth Cool Fastest in 2026:

Metro 2026 Price Growth % YoY
Cape Coral, FL -10.2%
North Port, FL -8.9%
Stockton, CA -4.1%
Raleigh, NC -3.7%
Deltona, FL -3.6%
Tampa, FL -3.6%
Spokane, WA -3.5%
Denver, CO -3.4%
Sacramento, CA -3.3%
San Francisco, CA -2.5%

Source: Realtor.com® 2026 National Housing Forecast

You'll notice Cape Coral, Florida, stands out with a projected double-digit price growth plunge of 10.2% year-over-year. This isn't a complete surprise if you've been following real estate trends. A recent report from analytics firm Cotality already highlighted Cape Coral as having the largest annual home price decline in Florida and the second-largest nationwide back in September, dropping 7.1%.

North Port, Florida, another market flagged by Cotality for cooling, is anticipated to see the nation's second-biggest decrease in price growth at 8.9%.

Why the Cooling? A Closer Look at Florida

It seems Florida is ground zero for this market correction. Realtor.com®'s senior economic research analyst, Hannah Jones, points out that these metros have already seen prices slip from their pandemic highs. She notes that elevated home prices, coupled with rising insurance premiums and other carrying costs, are weighing down buyer demand.

In fact, Realtor.com® data shows that statewide median listing prices in Florida were down 6% in the first half of 2025 compared to the same period in 2023. A big part of this dip is due to plummeting condo prices. This is largely a result of new safety legislation passed after the Surfside tragedy, which mandated more funding for building maintenance and inspections. This has led to significant increases in homeowner association (HOA) special assessment fees, making condo ownership much more expensive.

Jones also explains that Florida experienced a massive influx of new residents during the pandemic, fueled by remote work opportunities. This surge in demand helped drive prices sky-high. However, now we're seeing a correction. Rising mortgage rates, the aforementioned insurance costs, and climate-related risks are making buyers more cautious. This caution is pushing some owners to list their homes, increasing supply and consequently easing price pressures.

Karen Borelli, president of the Royal Palm Coast Realtor® Association, echoes this sentiment for Cape Coral. She mentions that home prices there have already dropped by 5% to 10% in recent years. The forecast for further price growth declines in 2026 doesn't surprise her. She explained that during the COVID-19 pandemic, demand from people seeking sunshine pushed prices up by a staggering 65% to 70%. After Hurricane Ian, the market shifted, with more homes becoming available and sales slowing down. Like the rest of Florida, escalating insurance costs and elevated mortgage rates are making homeownership less affordable.

However, Borelli offers a hopeful note for buyers in Cape Coral. She anticipates that in 2026, buyers will find a larger selection of homes and potentially reduced prices, along with builder and seller incentives. She emphasizes that real estate markets move in cycles, and while demand pushes prices up, a shift in inventory and demand can lead to more balanced conditions.

It's also worth noting that Florida Governor Ron DeSantis has been pushing for the elimination of property taxes on owner-occupied homes. Borelli suggests that if this policy is enacted, it could significantly impact home values, potentially leading to a rapid increase.

Beyond the Sunshine State: Western Markets See a Correction

While Florida is a major focal point, the cooling trend isn't confined there. Several California markets are also predicted to experience significant drops in home price growth. Stockton, in the Central Valley, is projected to see a 4.1% dip in 2026, making it the largest decrease in California and the third-largest nationwide.

Other major California cities like Sacramento (projected 3.3% decrease) and the famously expensive San Francisco (projected 2.5% decrease) are also expected to see their appreciation rates slow down.

Hannah Jones from Realtor.com® explains that these Western metros are adjusting after years of rapid price gains. Just like in the South, stretched affordability is a key driver. High prices and the persistent drag of high mortgage rates are eating into buyer demand, leading to potential price softening.

In Denver, Colorado, the growth rate is expected to decrease by 3.4% next year. Heather O'Leary, a real estate agent at eXp Realtor, attributes this partly to an increase in multifamily housing within the metro area. These types of properties typically have lower price points, which can pull down the median home price even if overall values remain relatively stable.

O'Leary also points out that for many low-income households in Denver, renting is currently more affordable than buying. This dynamic reduces demand for entry-level homes and contributes to declining median prices. Shifting migration patterns, with people moving from Denver's urban core to surrounding counties for more space and newer homes, also play a role. This outward movement redistributes demand and can slightly cool prices in the core city.

Despite the projected 3.4% pullback in Denver, O'Leary views it as a normalization rather than a collapse. She highlights Denver's current 3.6-month supply of inventory, which signals a move towards a more balanced market. For buyers, this cooling trend, combined with higher inventory, could mean more choices and a stronger position to negotiate. O'Leary notes that even a slight easing of interest rates could significantly boost a buyer's purchasing power.

For sellers, the key in these markets will be strategic pricing from the outset. Listing too high could lead to homes sitting on the market longer and requiring deeper price cuts later on.

What This Means for You: Buyers Find Leverage, Sellers Need Realism

The takeaway from all this data, sourced from Realtor.com®, is that 2026 is shaping up to be a more favorable year for homebuyers in certain regions. As Hannah Jones puts it, “For buyers, these cooling markets offer more leverage: greater negotiating power, more inventory to choose from, and more sellers willing to offer concessions.”

This cooling doesn't necessarily mean a housing market crash. Instead, it signifies a return to a more sustainable pace after a period of unsustainable growth. For those who have been priced out or struggling to compete in bidding wars, this could be the moment to re-enter the market with more confidence.

For sellers, it’s crucial to be realistic. The days of expecting multiple offers far above asking price might be over in these specific markets. Understanding current market conditions, pricing your home competitively, and being open to negotiation will be key to a successful sale.

The housing market is always evolving, and understanding these projected shifts is vital for anyone looking to buy or sell in the coming years. By paying attention to forecasts like Realtor.com®'s, we can make more informed decisions and navigate the real estate journey with greater clarity.

2026 Housing Market Forecast for Investors

Most experts forecast steady but modest price growth, shifting affordability, and evolving rental demand in 2026—creating unique opportunities for each group.

Rising demand keeps rental markets competitive, but turnkey investors benefit from strong cash flow.

Norada Real Estate helps you navigate these shifts with fully managed rental properties—so whether you’re buying, selling, or renting, you can position yourself for success in 2026.

🔥 HOT NEW Investor Deals JUST ADDED! 🔥

Talk to a Norada investment counselor today (No Obligation):

(800) 611-3060

Get Started Now

Want to Know More About the Housing Market Trends?

Explore these related articles for even more insights:

  • Housing Market Predictions for 2026 Show a Modest Price Rise of 1.2%
  • Housing Market Predictions 2026 for Buyers, Sellers, and Renters
  • Why Are Home Prices Dropping in Over Half of Major US Cities in 2025?
  • Redfin's Bold Predictions About The Great Housing Market Reset in 2026
  • 5 Most Expensive Housing Markets Are Now Seeing the Biggest Price Cuts
  • Housing Market Predicted to See Strong Growth in 2026: Expert Forecast
  • Housing Market Predictions for the Next 12 Months by Zillow
  • Housing Market Regains Ground as Falling Mortgage Rates Unlock Buyer Savings
  • Hidden Costs of Homeownership Now Add Up to Nearly $16,000 a Year
  • Small Investors Dominate the Housing Market From Detroit to Vegas
  • Housing Market Predictions for the Next 4 Years: 2025 to 2029
  • Housing Market 2025 Splits Between Wealthy Buyers and First-Timers
  • Housing Markets at Risk of Double-Digit Price Decline Over the Next 12 Months
  • Will the Housing Market Shift to a Buyer’s Market in 2026?
  • Mid-Atlantic Housing Market Heats Up as Mortgage Rates Go Down

Filed Under: Housing Market, Real Estate Market Tagged With: Housing Market, Housing Market Trends

5 Predictions That Will Define the NYC Housing Market in 2026

December 16, 2025 by Marco Santarelli

5 Predictions That Will Define the NYC Housing Market in 2026

In 2026, I expect New York City homes to sell faster, but don't panic, buyers! We're likely to see more homes hitting the market, so it won't be the wild frenzy of a few years back. For renters, expect a tougher go with rents climbing higher, largely because we just don't have enough apartments to go around.

It's crunch time in NYC's housing market, and frankly, things are getting complicated. I've been keeping a close eye on this city for years, and the trends I'm seeing point to some big shifts ahead for 2026. Based on the latest insights from StreetEasy®, here’s what is on the horizon for both folks looking to buy and those who are renting:

5 Predictions That Will Define the NYC Housing Market in 2026

1. Homes Will Fly Off the Shelves (But There's Still Hope for Buyers!)

Picture this: homes in NYC are going to start selling quicker in 2026. We're talking about the highest number of sales we've seen since 2022! Why? Well, mortgage rates are expected to keep inching down, but they'll still be a bit higher than we'd all like, probably sticking above 6%. This is great news for sellers, and it means buyers will need to be ready to jump when they see something they like.

But here's the good part for buyers: unlike the craziness of 2021 and early 2022, you probably won't have to battle it out with a dozen other people for every single apartment. StreetEasy® data shows that new listings are on the rise, and we’re seeing more homes come onto the market than we have in a while. This means there should be enough good options out there to go around.

Quick Look at Sales Pace:

Year Median Days on Market Trend
2024 (Previous Year Data) Slower Pace
2025 68 days Declining
2026 Expected to decline further Faster Pace Expected

2. Sharing is Caring: Co-Buying on the Rise

Buying a home in NYC is tough. My gut feeling is that more and more people will team up to buy. StreetEasy® found that a huge chunk of folks looking to buy want to do it with someone else – maybe a partner, but increasingly, friends or family are stepping in. This idea of “third-way” ownership, where you buy with people you’re not romantically involved with, makes a lot of sense when prices are high and mortgages are a challenge.

Think about buying a duplex or a triplex: you get your own space, but you’re also sharing bills and making it a bit more affordable. Plus, with more older folks looking to downsize within the city, these kinds of multi-family homes are becoming super desirable.

  • 56% of prospective NYC buyers planned to buy with a co-buyer in a recent survey.
  • This includes buying with friends (9%) and relatives (6%), not just spouses.

However, finding affordable multi-family homes is like finding a needle in a haystack. We need more options, and maybe some smart changes to zoning laws could help create more of these flexible living spaces.

3. Rents Will Keep Climbing (Yep, It's Still Tough Out There)

While the rest of the country might see rents cool down, here in NYC, I predict they'll heat up. We’ve seen rents go up by almost 5% this year already, and with fewer apartments available and people staying put longer, that number is likely to climb even more in 2026.

Even though a bunch of new buildings have been popping up, it’s not enough to fix our massive housing shortage that’s been building for decades. Plus, with jobs feeling a little shaky for some and mortgage rates still high, more people will stay renting. This means more competition for apartments, and that always pushes prices up.

Key Factors for Renters in 2026:

  • Chronic undersupply: Not enough apartments for everyone.
  • Job security concerns: Making people hesitant to buy.
  • High mortgage rates: Keeping homeownership out of reach for many.
  • Declining vacancy rates: Fewer options mean more competition.

4. Forget “Luxury,” Think “New Build” for Affordability

This one might surprise you, but rentals in new buildings are actually starting to look like the more affordable option in 2026. Why? Because there are so many new ones being built, and landlords are using deals like free months of rent to fill them up. Meanwhile, rents in older buildings, especially in popular, well-connected neighborhoods, are skyrocketing.

Since 2019, rents in new buildings (after deals) have gone up about 20%, while older buildings have seen a 23.1% jump. This makes those shiny new apartments a more attractive bet, even if they’re a bit further out from the prime spots.

It's a clear sign: building more housing, whether new or by fixing up existing places, is the best way to tackle rising costs. It’s good to see the city finally making moves with things like the “City of Yes for Housing Opportunity” plan and new tax incentives, but there's still a long way to go.

5. Community is King: Renters Want More Than Just an Apartment

As homeownership slips further away for many, renters are staying renters for longer, and they're looking for more. StreetEasy® data shows the average age of renters is creeping up. This means people want their apartments to feel like home, and that includes having a sense of community and convenience.

New buildings are catching on. They’re adding more shared spaces like lounges, rooftop decks, party rooms, and even coworking spaces. It’s not just about having a roof over your head anymore; it’s about having a lifestyle. These communal areas are becoming a big selling point, and I think this trend will only get bigger.

What Renters are Looking For in New Buildings:

  • Lounges: 61% of newer buildings offer them.
  • Rooftop Decks: A staple in 63% of new rentals.
  • Coworking Areas: Nearly doubles in new buildings (19% vs. 11%).
  • Wellness Spas: Available in 29% of new construction.

It’s all about making rental buildings feel more like a neighborhood within themselves. Property managers who offer these kinds of amenities will definitely win out.

Want Stronger Returns? Invest Where the Housing Market’s Growing

Turnkey rental properties in fast-growing housing markets offer a powerful way to generate passive income with minimal hassle.

Work with Norada Real Estate to find stable, cash-flowing markets beyond the bubble zones—so you can build wealth without the risks of ultra-competitive areas.

🔥 HOT NEW LISTINGS JUST ADDED! 🔥

Talk to a Norada investment counselor today (No Obligation):

(800) 611-3060

Get Started Now

Read More:

  • NYC Housing Market: Prices, Trends, Forecast 2025-2026
  • How Much Do Real Estate Agents Make in New York?
  • 5 Predictions That Will Define the NYC Housing Market in 2025
  • Albany Housing Market Trends and Forecast for 2025
  • Syracuse Housing Market Trends and Forecast for 2025
  • NYC Housing Market Report: Rent Prices Are Skyrocketting
  • Rent-to-Own Homes in NYC: A Pathway to Homeownership
  • Long Island's Housing Crisis: Can New York Fix This Market
  • New York Housing Market: These 3 Cities Are Hottest in the Nation
  • New York Real Estate Market: Should You Invest Here?
  • Worst Places to Live in the New York State

Filed Under: Growth Markets, Housing Market Tagged With: Housing Market, New York, New York City, NYC

  • « Previous Page
  • 1
  • 2
  • 3
  • 4
  • …
  • 88
  • Next Page »

Real Estate

  • Birmingham
  • Cape Coral
  • Charlotte
  • Chicago

Quick Links

  • Markets
  • Membership
  • Notes
  • Contact Us

Blog Posts

  • Mortgage Rates Reset 2026: Ultra-Low Rates End, 6% Becomes Normal
    December 23, 2025Marco Santarelli
  • Is the 30-Year Fixed Mortgage Rate Set to Break into the 5% Range?
    December 23, 2025Marco Santarelli
  • Top Turnkey Real Estate Markets for 2026: The Investor’s Guide
    December 23, 2025Marco Santarelli

Contact

Norada Real Estate Investments 30251 Golden Lantern, Suite E-261 Laguna Niguel, CA 92677

(949) 218-6668
(800) 611-3060
BBB
  • Terms of Use
  • |
  • Privacy Policy
  • |
  • Testimonials
  • |
  • Suggestions?
  • |
  • Home

Copyright 2018 Norada Real Estate Investments

Loading...