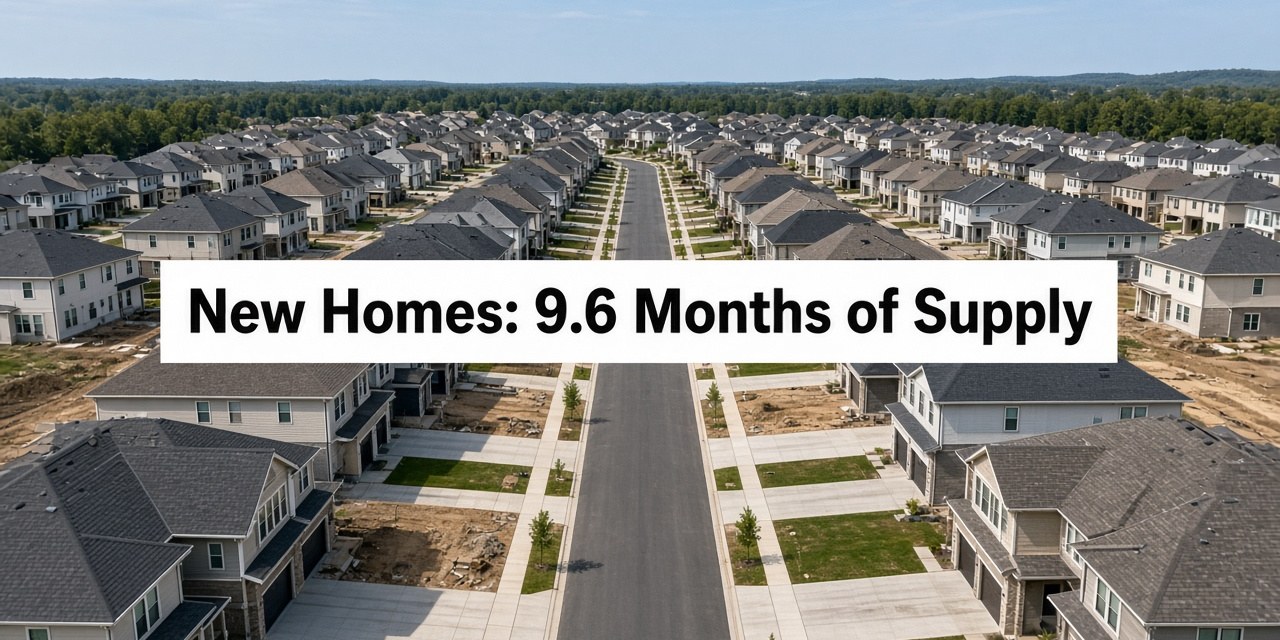
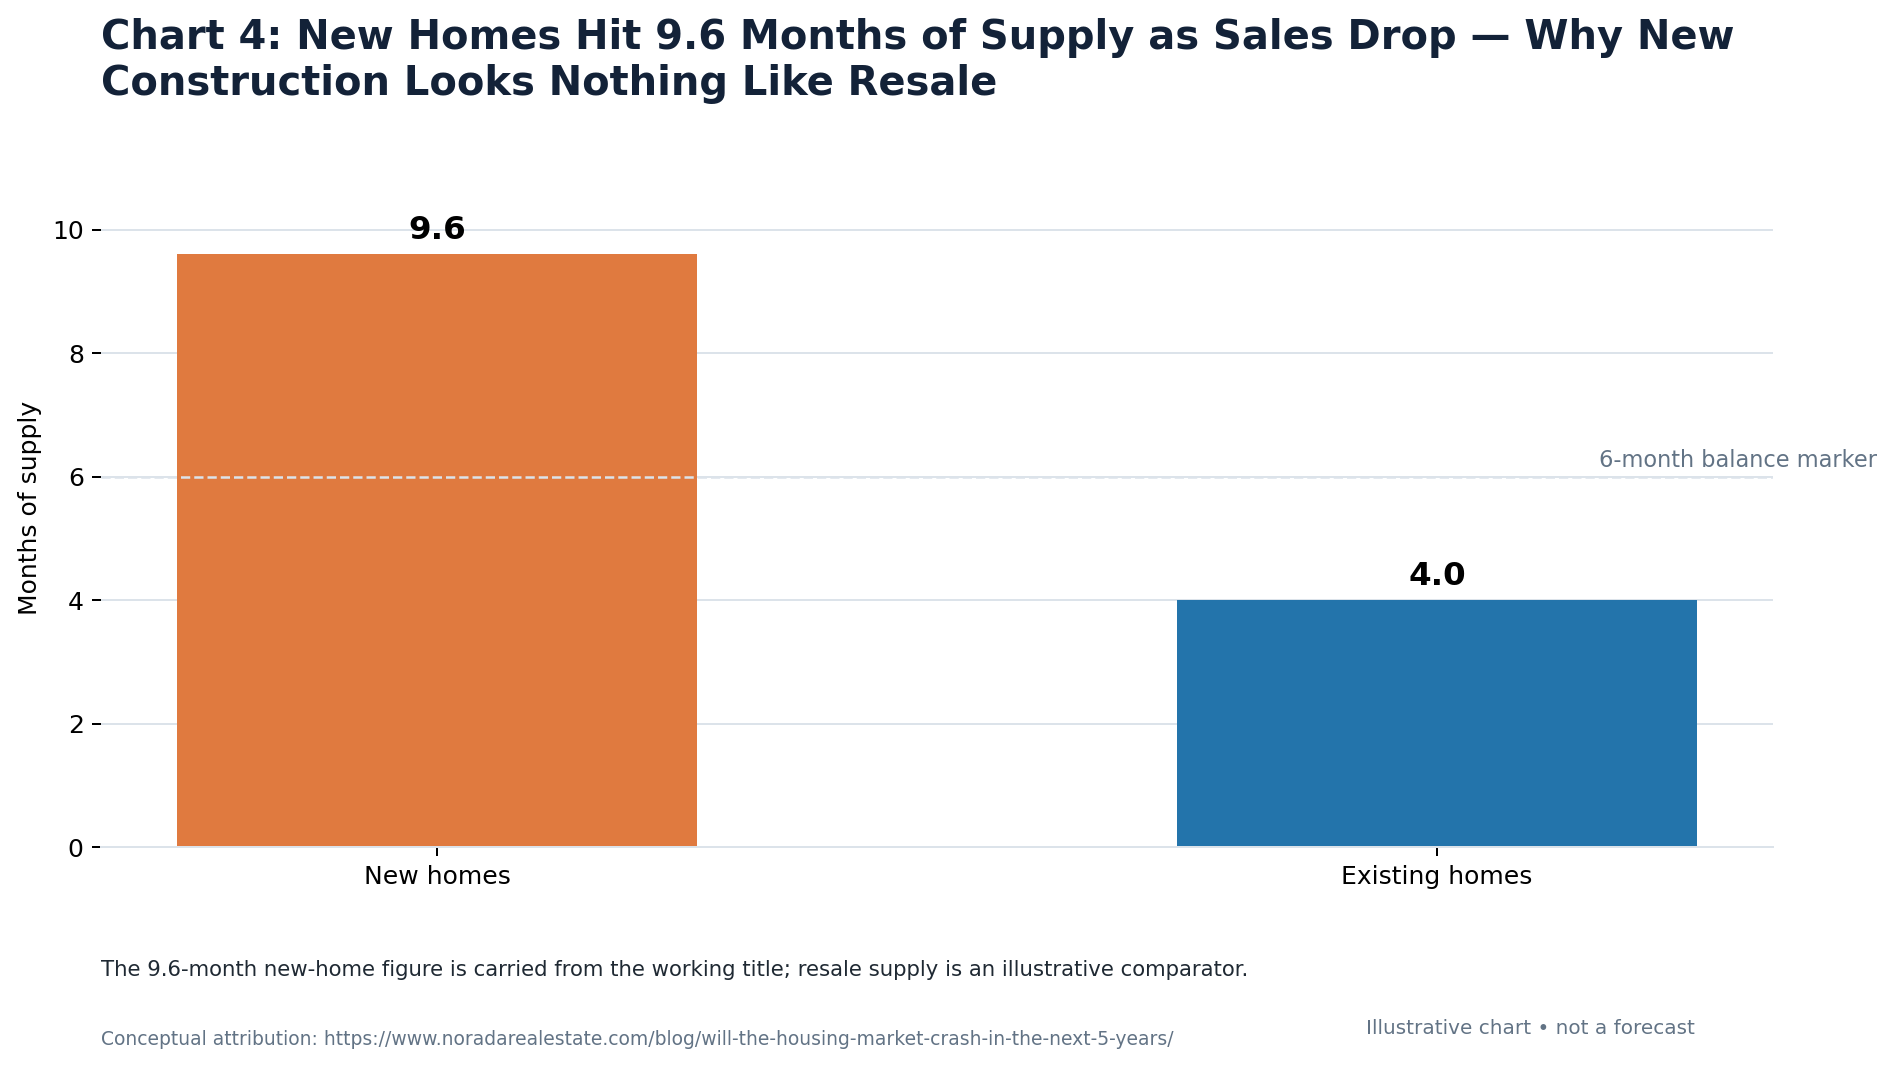
New single-family homes for sale represented about 9.6 months of supply in July 2026 after sales fell to a 607,000 seasonally adjusted annual rate — down 10.5% from June — according to the U.S. Census Bureau and HUD. Existing homes, by contrast, have been hovering near roughly 4.9 months of supply. Same country, same mortgage-rate regime near 7%, two different markets.
That split is the story. Builders carry finished and nearly finished inventory they must move; many resale owners still sit on sub-4% mortgages that make listing feel expensive. The Fed’s +25 bp hike to 3.75%–4.00% (SEP ~4.1%) reinforces expensive financing for both channels without erasing the supply gap between them.
New Homes Hit 9.6 Months of Supply as Sales Fall — Why New Construction Looks Nothing Like Resale
The July Census/HUD Print in One Screen
- Sales: 607,000 SAAR (−10.5% MoM; −6.3% YoY)
- For-sale inventory: 488,000 (+1.9% MoM)
- Months’ supply: 9.6 (up from 8.5 in June; 9.2 a year earlier)
- Median price: $393,800 in the July release
Six months of supply is the textbook “balanced” benchmark many analysts still recite. At 9.6 months, new construction is clearly seller-stressed on absorption — even if individual master-planned communities still feel busy on weekends.
Why New Construction Looks Nothing Like Resale
Resale supply is capped by lock-in, life events, and owners’ willingness to trade a cheap coupon for a ~7% replacement loan. New-home supply is capped by how fast builders started homes 9–18 months ago and how willing they are to idle crews. When starts earlier in the cycle outran today’s rate-constrained demand, finished inventory shows up as months’ supply — not as a polite national average.
| Channel | Supply feel (mid-2026) | Seller toolkit |
|---|---|---|
| New construction | ~9.6 months’ supply | Rate buydowns, upgrades, selective price cuts |
| Existing homes | ~4.9 months’ supply | List-price cuts, credits, longer DOM |
| Mortgage backdrop | ~7%+ 30-year surveys | Payment is the binding constraint |
HousingWire and other trade outlets have emphasized completed-inventory pressure for builders precisely because a house that is finished burns cash until it closes. That is a different urgency clock than a homeowner who can simply delist and keep the 3% mortgage.
Incentives Follow the Glut
When months’ supply runs near 10, expect more of what Realtor.com and NAHB already flag: advertised rate help near 4%, closing-cost credits, and selective reductions — covered in builder ~4% mortgage ads and September incentive and price-cut shares. Those tools can clear payments without forcing every community’s recorded median to collapse. They also complicate appraisals and comps for nearby resale sellers.
What Buyers Should Do With a 9.6-Month Read
Shop new and resale as competing baskets, not separate religions. On new homes, negotiate the permanent value: price, rate duration, and upgrade credits. On resales, use local price-cut prevalence and inspection leverage. Underwrite insurance and taxes either way — premiums keep raising the real payment even when the note rate is fixed later.
- Ask how many finished specs sit in the community and how long they have been on the market.
- Compare the builder’s best net sheet with a resale after a realistic credit.
- Do not assume a 9.6-month national print means your subdivision is desperate; absorption is hyper-local.
What Resale Sellers Should Notice
If a builder three miles away is advertising mid-3% to low-4% financing, your “firm” ask competes with a subsidized payment. Price and condition have to answer that comparison. Soft existing sales already show the demand side is thin; ignoring new-home competition makes it thinner for you.
Completed Specs vs. Homes Still Under Construction
Months’ supply blends finished specs, under-construction contracts, and to-be-built slots depending on how Census categorizes stages — and builders feel finished inventory most acutely. A completed house accrues interest, taxes, insurance, and opportunity cost every month it sits. That is why you see glass-house lighting on empty specs and aggressive rate posters at the entrance. To-be-built homes can sometimes wait for a better rate tape; finished ones cannot.
Ask sales counselors for a simple breakdown: how many finished homes are available now, how long the oldest has sat, and what incentives apply only to standing inventory. Those answers tell you more than a national 9.6 print.
Regional Divergence Inside the 607,000 SAAR
July’s Census release showed sharp regional swings — including a steep Midwest drop and offsetting moves elsewhere — with wide margins of error on some components. Treat the national SAAR as a direction signal and the months’ supply as the stress signal. A noisy sales month can reverse; a sustained climb in for-sale inventory toward 488,000 while sales sag is harder to dismiss. Trade coverage noting Midwest weakness alongside still-elevated national supply fits a market where geography matters as much as the Fed.
Implications for Land, Starts, and 2027 Supply
Builders who already own lots face a choice: start fewer homes, or keep starting and sell with richer incentives. NAHB’s soft HMI suggests caution on new starts, which could tighten new-home supply later even if today’s finished stock looks heavy. Buyers who need a house in the next six months are negotiating into a glut. Buyers with a two-year horizon should watch starts and cancellations, not only today’s model-home discounts. Resale owners hoping “no new supply” will bail out their ask should remember that lock-in still limits existing listings even while builders work through specs.
For a payment-first shopping path across both channels, compare rent vs buy cash flow at 7% before you stretch into a larger new-home payment just because the rate poster looks friendly.
Price Medians vs. Discount Reality on New Homes
July’s median new-home price in the Census release sat near $393,800, while the average was much higher — a reminder that mix shifts (which homes sell, in which regions) can move medians even when incentives are rich. A community can report firm ASP while still delivering $40,000 effective value through rate buydowns and upgrades. Shoppers who only watch median price charts miss the concession layer; shoppers who only watch yard-sign rates miss the contract price. You need both.
Resale medians and new-home medians diverge for the same reason supply diverges. Existing owners with cheap coupons are not forced to meet the market every month. Builders are. That is the structural reason new construction “looks nothing like resale” in a 7% world — and why incentive prevalence belongs in every new-vs-old comparison.
Checklist Before You Sign a New-Home Contract
- Get the total incentive in dollars and in rate terms, written.
- Ask which incentives expire at month-end (many do).
- Compare lot premiums and options after negotiation, not before.
- Review HOA budgets and special assessment history for the community.
- Run insurance quotes early — new construction is not immune to premium spikes.
- Walk finished specs at twilight; empty houses reveal punch-list issues daylight tours miss.
Bottom Line
July’s Census/HUD release — 607,000 SAAR sales, 488,000 homes for sale, 9.6 months of supply — shows new construction carrying a glut that resale (~4.9 months) does not. Near 7% mortgages and a Fed funds range of 3.75%–4.00%, expect builders to keep buying down payments while many existing owners stay locked in. The national housing story is not one market; it is at least two, sharing the same rate ceiling.
VS

Saint Louis offers a budget‑friendly 4‑bed rental with a high cap rate, while Indianapolis provides a classic 2‑bed property with steady cash flow. Which Midwest market fits YOUR investment strategy?
We have much more inventory available than what you see on our website – Let us know about your requirement.
📈 Choose Your Winner & Contact Us Today!
Speak to a Norada Investment Counselor (No Obligation):
(800) 611-3060
Also Read:
- Top 10 Housing Markets Set to Deliver High ROI in 2026
- Top 10 Most Popular Housing Markets of 2025 for Homebuyers
- Will Real Estate Rebound in 2026: Top Predictions by Experts
- Housing Market Predictions for the Next 4 Years: 2026, 2027, 2028, 2029
- Housing Market Predictions for 2026 Show a Modest Price Rise of 1.2%
- Housing Market Predictions 2026 for Buyers, Sellers, and Renters
- 12 Housing Markets Set for Double-Digit Price Decline by Early 2026
- Real Estate Forecast: Will Home Prices Bottom Out in 2025?
- Housing Markets With the Biggest Decline in Home Prices Since 2024
- Why Real Estate Can Thrive During Tariffs Led Economic Uncertainty
- Rise of AI-Powered Hyperlocal Real Estate Marketing in 2025
- Real Estate Forecast Next 5 Years: Top 5 Predictions for Future
- 5 Hottest Real Estate Markets for Buyers & Investors in 2025